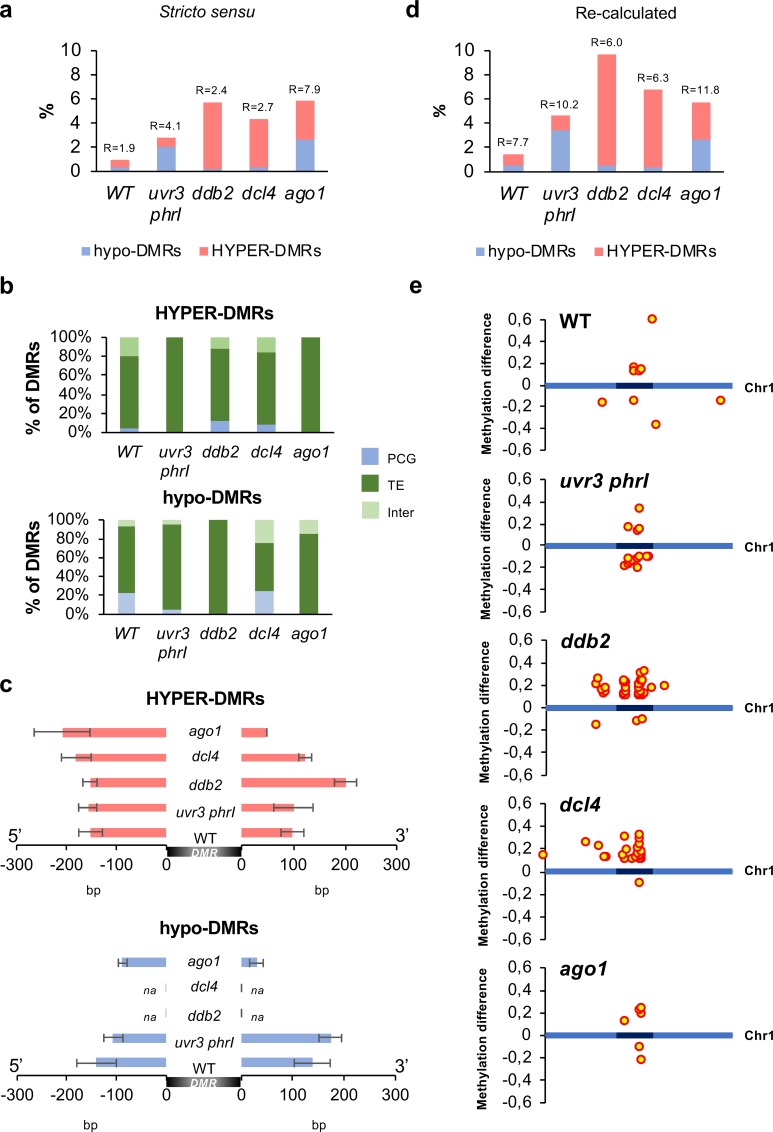
Fig 6. DMRs overlapping with photolesions.
a Histograms representing the percentage of hypo- and hyper-DMRs overlapping with photolesions (stricto sensu) in WT, uvr3 phrI, ddb2, dcl4 and ago1 plants. R: Representation factor showing the statistical significance of the overlap between DMRs and photolesions (stricto sensu). b Histograms representing the percentage of the identity (protein-coding genes: PCG, TE and intergenic) of hyper- and hypo-DMRs overlapping with photolesions in WT, uvr3 phrI, ddb2, dcl4 and ago1 plants. c Histograms representing the average length (base pair: bp) of hypo- and hyper-DMRs spreading outside photolesions in WT, uvr3 phrI, ddb2, dcl4 and ago1 plants. na: non-applicable. d Histograms representing the percentage of the corrected hypo- and hyper-DMRs overlapping, with photolesions in WT, uvr3 phrI, ddb2, dcl4 and ago1 plants. R: Representation factor showing the statistical significance of the overlap between DMRs and photolesions. e Distributions of the corrected DMRs overlapping with photolesions along chromosome 1 (light blue: chromosome arms, dark blue: pericentromeric regions). Hyper- and hypo-DMRs are shown above and below each chromosome, respectively.

