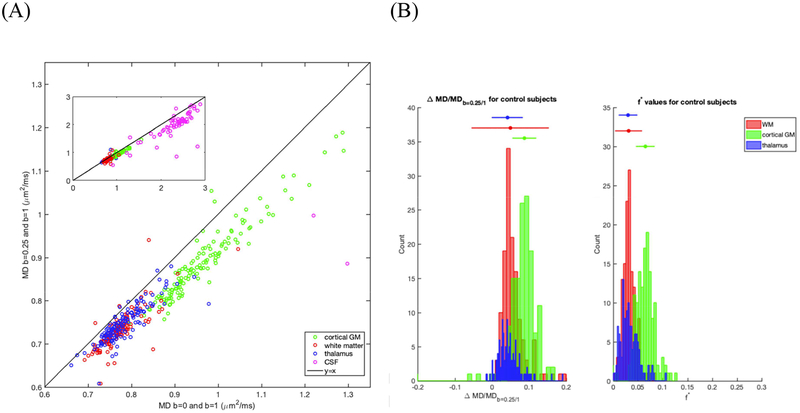
Figure 3:
Differences in MD and in f* calculated from using b = 0–1000 s/mm2 and b = 250–1000 s/mm2 in CSF (magenta), Thalamus (blue), WM (red), and cortical GM (green) across 137 healthy subjects. (A) Scatter plot of the calculated difference in mean MDs over cortical GM, WM, and CSF of each ROI. Reference line of y=x is shown in black in both panels. (B) Histograms of the percent change in MD with respect to MD from b = 250–1000 s/mm2 (panel 1) and histograms of f* (panel 2). 4 subjects not shown in WM and 1 subject not shown in cortical GM for ease of visualization.

