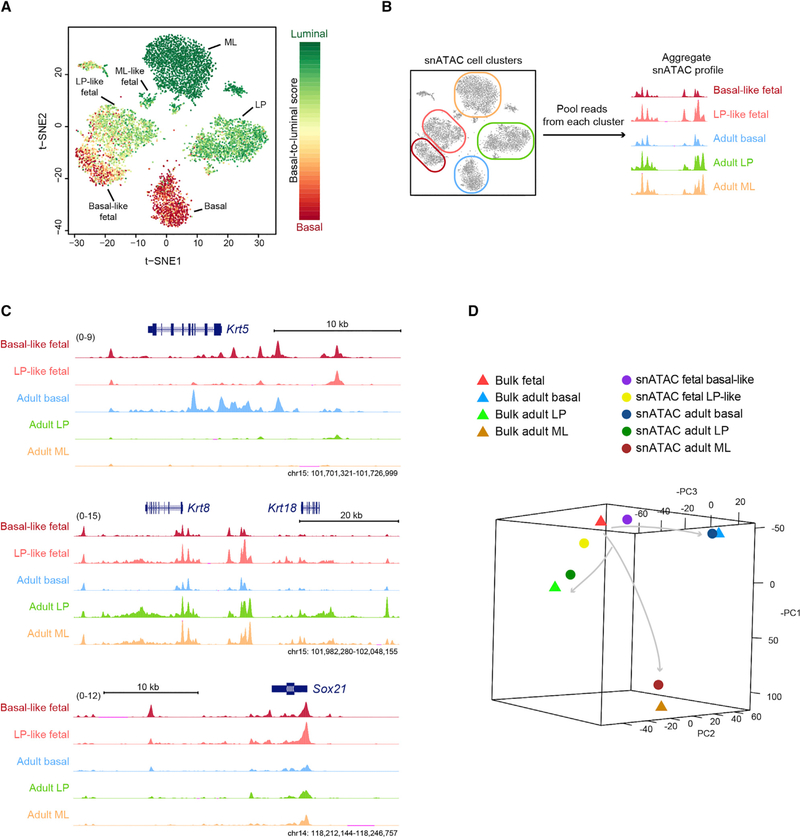
Figure 2. Fetal Mammary Cells at E18 Show Epigenetic Features of Partial Lineage Specification.
(A) Single-cell basal-to-luminal score overlaid on the snATAC t-SNE plot. Cell cluster identities are shown.
(B) Approach to generating an aggregate snATAC profile based on single-cell clustering.
(C) Signal tracks of the aggregate snATAC profile. Signal ranges are shown in the parentheses.
(D) PCA comparing the aggregate snATAC profile with bulk ATAC-seq of sorted mammary populations. Arrows indicate putative mammary differentiation paths.
See also Figure S4.

