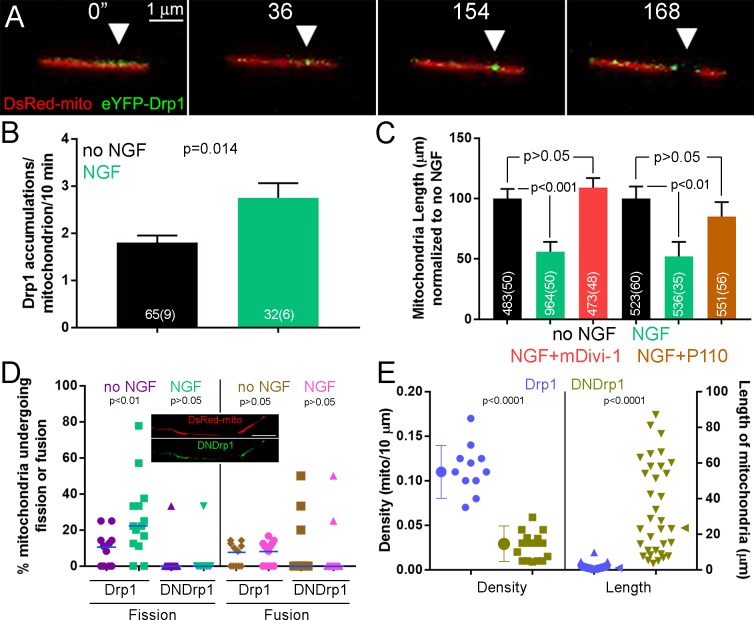
Figure 2. The Drp1 GTPase mediates NGF-induced fission.
(A) Example of the formation of eYFP-Drp1 puncta (example from NGF treated axons). eYFP-Drp1 is initially heterogeneously distributed along the mitochondrion (0’). By 36 s Drp1 has begun to accumulate at the future site of fission, denoted by the arrowhead in all panels. During the ensuing period the accumulation of Drp1 becomes more focal and pronounced culminating with fission occurring at 154 s and the mitochondria moving apart by 168 s. (B) Quantification of the number of eYFP-Drp1 accumulations per mitochondrion during the first 10 min after treatment with NGF. n = mitochondria(axons) shown in bars, Mann-Whitney test. (C) Determination of mitochondria lengths with a 15 min pretreatment with 20 μM mDivi-1 followed by a 45 min treatment with NGF. Throughout this work mDivi-1 was used at 20 μM as this concentration inhibits fission without impacting complex I of the respiratory chain (Bordt et al., 2017; Smith and Gallo, 2017). Determination of mitochondria lengths after a 30 min pretreatment with 5 μM P110 followed by a 30 min treatment with NGF. For all pharmacological experiments in this report treatment with vehicle (DMSO) was performed as control. n = mitochondria(axons) shown in bars; Dunn’s posthoc tests. (D) Live imaging analysis of the rates of fission (% mitochondria/10 min) before and after NGF treatment (0–10 min) in the axons of eYFP-Drp1 (Drp1) or eYFP-DNDrp1 (dominant negative Drp1; DNDrp1) expressing neurons. Mitochondria were labeled through co-expression of mitochondrially targeted DsRed. Each data point reflects one axon. Mann-Whitney tests. Blue lines denote median. The inset shows and example of DNDrp1 expression. As with wild type Drp1 DNDrp1 targeted to mitochondria. Bar = 5 μm. (E) Mitochondria length and densities in the axons of neurons expressing Drp1 or DNDrp1 in the no NGF condition prior to NGF treatment. Data points for density represent axons and for lengths individual mitochondria within those axons. Mann-Whitney test and Welch t-test for length and density comparisons respectively. Mean and SD are shown to the left of data points for density, and median is denoted by arrowheads to the right of data points for length.


