. 2019 Dec 2;8:e49494. doi: 10.7554/eLife.49494

Figure 4. PI3K and Mek-Erk signaling are required for NGF-induced mitochondria fission.

(A) Inhibition of PI3K (LY294002, LY, 25 μM) or Mek-Erk (U0216, U, 50 μM; PD325901, PD, 1 μM) both prevented the NGF-induced increase in the rate of mitochondria undergoing fission during the first 10 min of NGF treatment (% mitochondria/10 min). Each data point reflects an axon. The no NGF and NGF groups received the DMSO vehicle and are the same as shown in Figure 3B as pharmacological experiments were performed in parallel. Dunn’s posthoc multiple comparison tests performed using no NGF, NGF and NGF+drug group within drug treatment. Median is denoted by arrowheads to the right of data points. (B) LY and U/PD pretreatment blocks the NGF induced increase in the formation of Drp1 accumulations along mitochondria. Same experimental design as in (A), n = mitochondria(axons) shown in bars. Dunn’s posthoc multiple comparison tests performed using no NGF, NGF and NGF+drug group within drug treatment. (C) Examples of axons stained with anti-pS616-Drp1 antibodies and phalloidin to reveal actin filaments (F-actin). The pS616-Drp1 staining pattern was punctate. NGF elevated the staining levels and pretreatment with U prevented the NGF-induced increase. The bottom panels show empty magnification examples of the axonal domains denoted by the parallel lines in the pS616-Drp1 panels above. For presentation purposes, all images in panel were equally digitally brightened to enhance visual appreciation of the signal. (D) Quantification of the total intensity of pS616-Drp1 staining in distal axons. Each datum reflects one axon, Dunn’s posthoc multiple comparison tests within drug treatment experiment. Median is denoted by arrowheads to the right of data points.

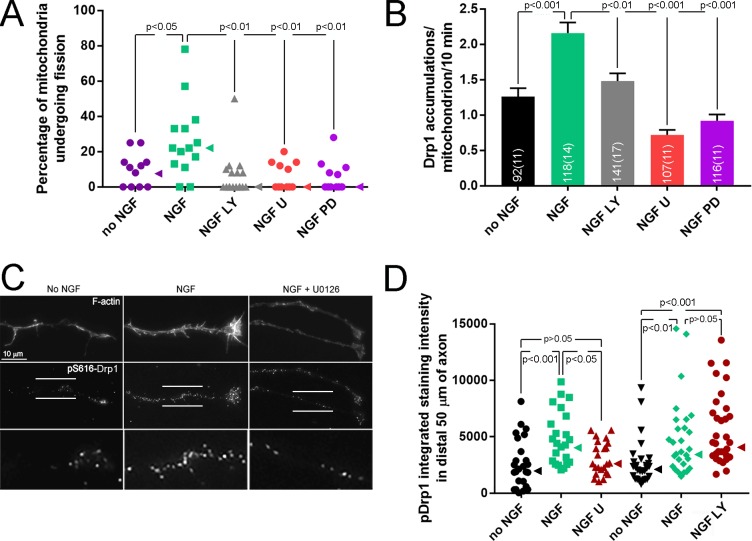
Figure 4.

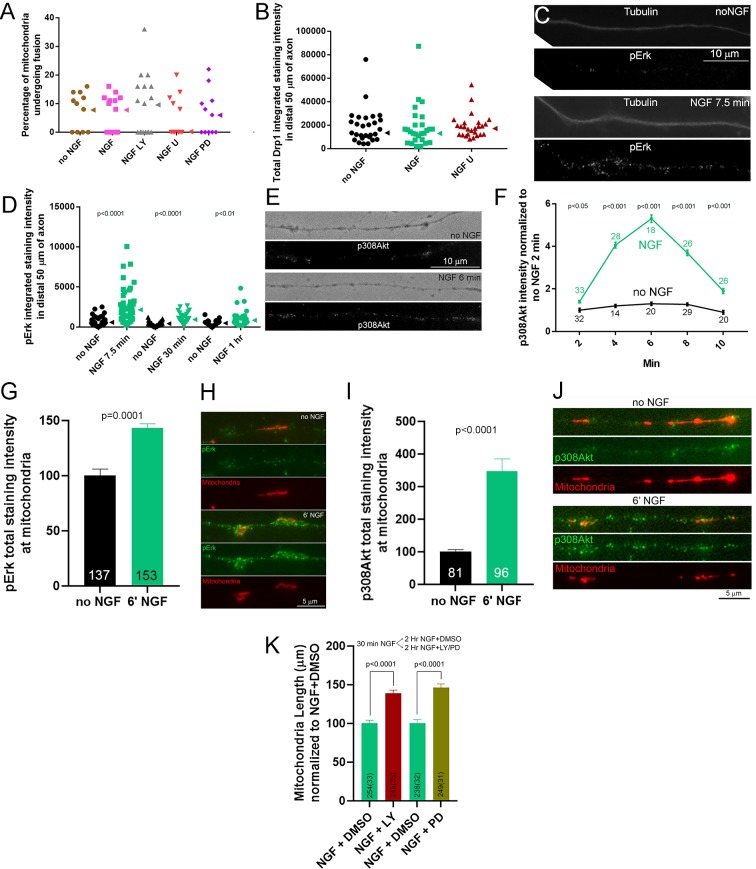
Figure 4—figure supplement 1. Signaling mechanism of NGF-induced fission.

Figure 4—figure supplement 1.

(A) Inhibition of PI3K (LY294002, LY) or Mek-Erk (U0216, U; PD325901, PD) did not affect the rate of fusion (% mitochondria showing fusion/10 min). Kruskal-Wallis ANOVA p=0.79 and p=0.86 for LY and U/PD experiments, respectively. Median is denoted by arrowheads to the right of data points. (B) NGF treatment did not impact the levels of total Drp1 protein in axons and treatment with NGF and U did not alter levels relative to NGF alone. Kruskal-Wallis ANOVA p=0.63. Median is denoted by arrowheads to the right of data points. (C) Examples of pErk staining along axons counter-stained to show tubulin. For presentation purposes, all images in panel were equally digitally brightened to enhance visual appreciation of the signal. (D) Quantification of the total intensity of pErk staining along axons at 7.5 min post NGF treatment, when fission is occurring, and at 1 hr after NGF when the new steady state is established. Each datum reflects one axon, Mann-Whitney tests. Median is denoted by arrowheads to the right of data points. (E) Examples of axons stained with antibodies to Akt phosphorylated at T308. Phase contract image of axon is also shown. For presentation purposes, all images showing fluorescence in panel were equally digitally brightened to enhance visual appreciation of the signal. (F) Graph showing the staining intensity along the distal 50 μm of axons stained with antibodies to Akt phosphorylated at T308 normalized to the intensity for the 2 min no NGF treatment. n = number of axons shown above each time point. Results of analysis performed on raw data using Dunn’s posthoc time-matched multiple comparisons between NGF and no NGF groups are shown. (G) Graph of the total intensity of pErk in segments of axons defined by the presence of mitochondria in no NGF treatment and 6 min NGF treatment groups. n in bars represents mitochondria from 37 and 38 axons, respectively. Welch t-test. (H) Examples of pErk staining along axons expressing DsRed-mito in no NGF and at 6 min of NGF treatment groups. (I) Graph of the total intensity of p308Akt in segments of axons defined by the presence of mitochondria in no NGF treatment and 6 min NGF treatment groups. n in bars represents mitochondria from 32 and 34 axons, respectively. Welch t-test. (J) Examples of p308Akt staining along axons expressing DsRed-mito in no NGF and at 6 min of NGF treatment groups. (K) Graph showing the effects of inhibiting PI3K (LY) or Mek-Erk (PD) on mitochondria length during the NGF-induced steady state. Following a 30 min NGF treatment cultures were treated with either LY or PD for an additional 2 hr in the continued presence of NGF. Mann-Whitney tests.