. 2019 Dec 2;8:e49494. doi: 10.7554/eLife.49494

Figure 5. Inhibition of fission impairs NGF-induced axon branching.

(A) Example of NGF-induced axon branching. Top panels show axonal morphology in the no NGF treatment group. Some axonal filopodia are present but not branches. Bottom panels show an NGF-treated axons with four branches (green arrowheads). Mature branches contain microtubules and distally actin filaments. (B) Quantification of axon branches ± mDivi-1 or DMSO pretreatment. For panels (B)-(D) n = axon numbers shown in (). Mann-Whitney test. (C) Quantification of axon branches ± P110 or vehicle pretreatment. Mann-Whitney test. (D) Quantification of axon branches in dissociated neurons cultured overnight in NGF expressing eYFP (baseline control), eYFP-Drp1 or eYFP-DNDrp1. The differences in baseline branch number reflect the use of dissociated neurons relative to explant cultures as in panels (B) and (C) for the acute NGF treatment experiments. Mann-Whitney test. (E) Quantification of the rates of actin patch formation ±mDivi-1 or DMSO treatment. Each data point reflects one axon and the number of axons is shown in () below the data. Dunn’s posthoc multiple comparison tests. (F) and (G) Quantification of mitochondria length and density, respectively, in the axons and branches of axons emanating from explants raised in either no NGF or NGF overnight. n = axons shown in the bars labeled Axons; n for branches from this set of axons is denoted in the bars labeled Branches. Mean and SEM. Mann-Whitney tests.

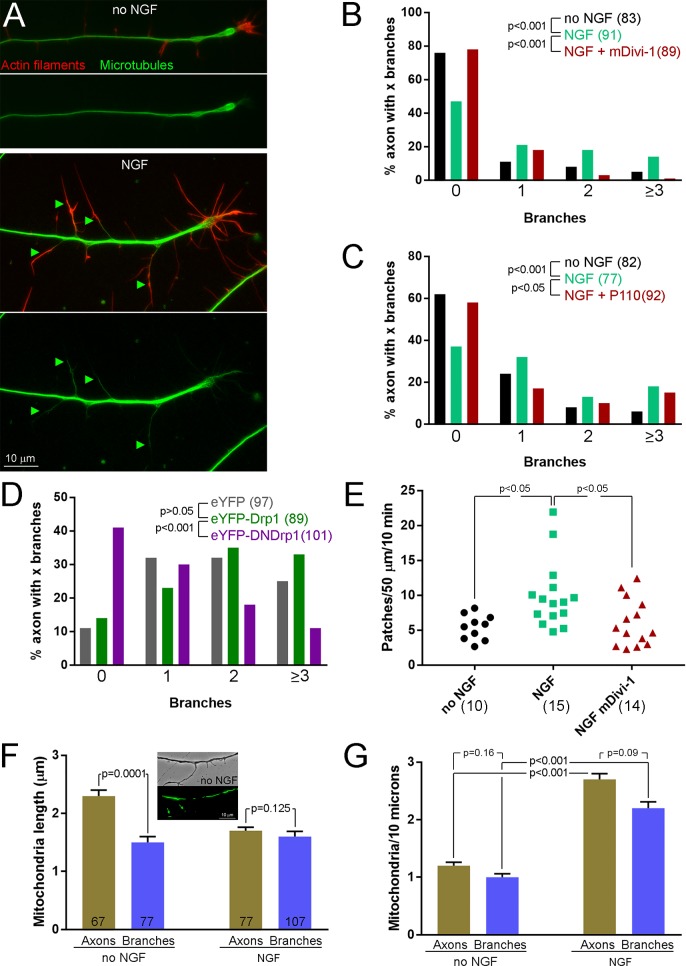
Figure 5.

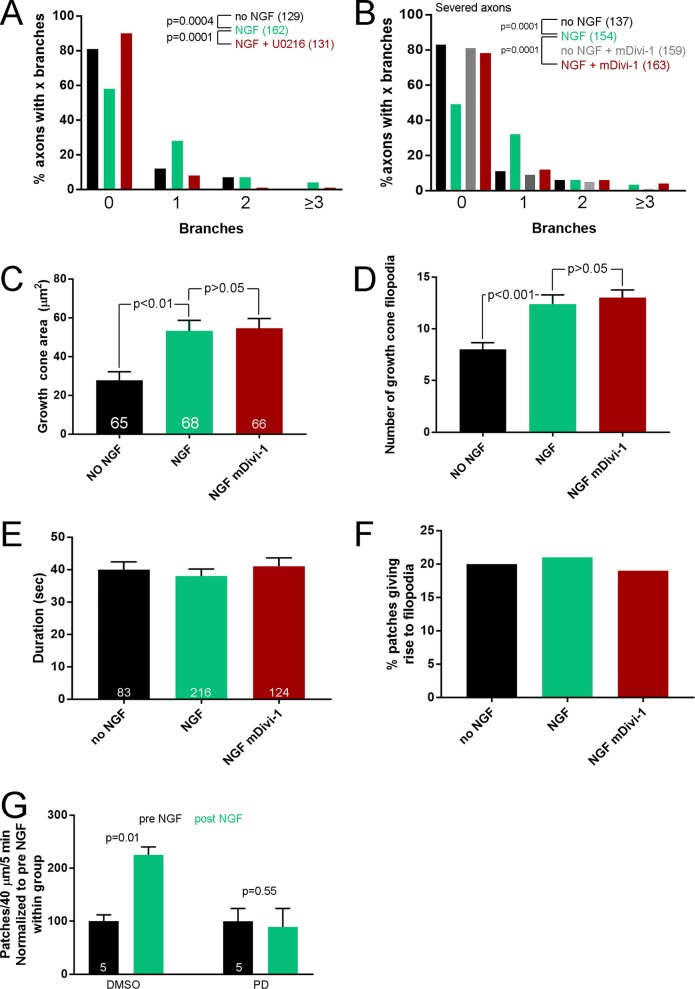
Figure 5—figure supplement 1. Role of fission in branching.

Figure 5—figure supplement 1.

(A) Pretreatment (15 min) with the Mek-Erk inhibitor PD325901 (PD) blocks NGF-induced axons branching (40 min treatment). Mann-Whitney tests. (B) Severing of axons to isolate them from the cell bodies does not prevent the inhibition of NGF-induced axon branching (40 min treatment) by a 15 min pretreatment with mDivi-1 started immediately after axon severing. (C) A 15 min pretreatment with mDivi-1 does not impact the increase in growth cones area induced by a 10 min treatment with NGF. n = growth cones, one growth cone per axon, shown in the bars. Bonferroni multiple comparison tests. (D) Pretreatment with mDivi-1 similarly does not affect the NGF-induced increase in the number of filopodia at growth cones. Same sets of growth cones as in (B). Dunn’s multiple comparison tests. (E) mDivi-1 did not impact the duration of actin patches formed 30 min after NGF treatment. n = number of patches shown in bars from the axons shown in Figure 5E. Bonferroni multiple comparison tests. (F) mDivi-1 did not alter the percentage of patches that gave rise to filopodia. Same data set as in panel (D), Fischer’s exact tests. Fisher’s exact tests. (G) Analysis of actin patch formation rates in a pre-post NGF treatment design within axons pretreated with DMSO or PD for 15 min prior to sampling the pre-NGF rates. n = axons shown in bars, paired t-tests. Comparison of the pre NGF rates did not show an effect of PD relative to DMSO (p=0.87, Welch t-test).