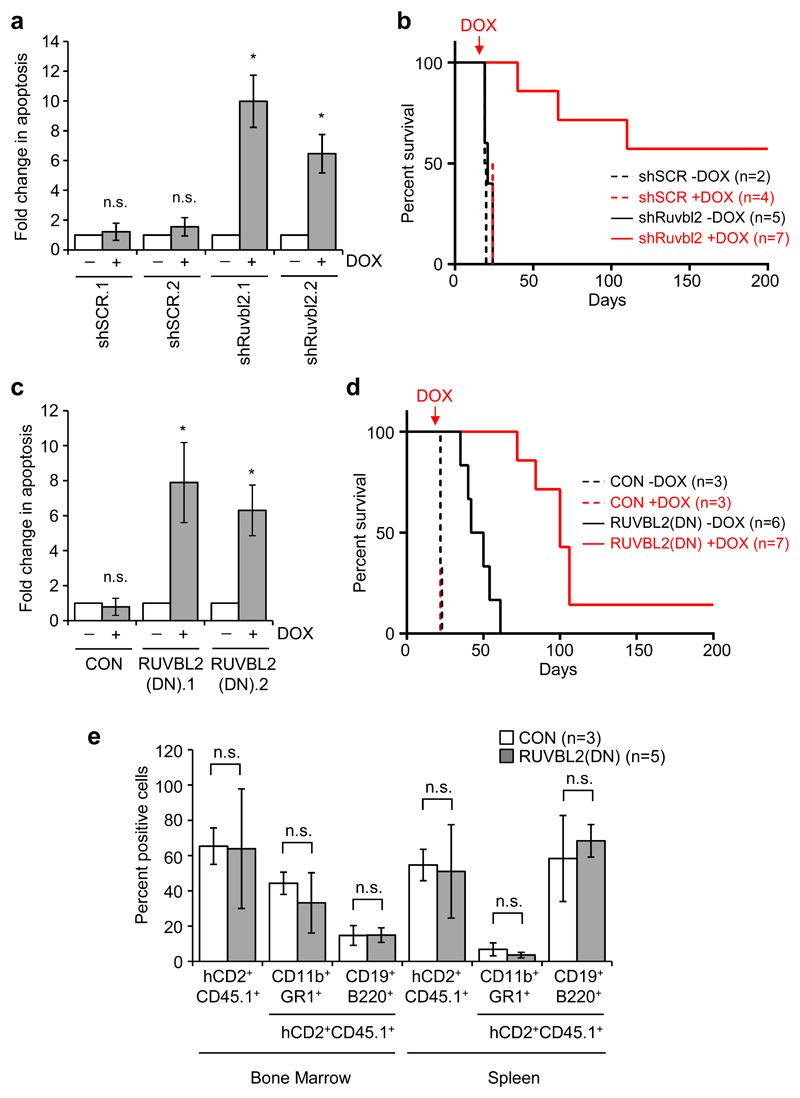
Fig. 2. RUVBL2 inhibition impairs AML progression but not normal hematopoiesis.
a Apoptosis induction in mouse MLL-ENL clones, inducibly expressing control (shSCR) or mouse Ruvbl2-specific (shRuvbl2) shRNA 6 days after doxycycline treatment. Bars and error bars represent means and SD of fold changes in apoptosis (annexin V positive cells) from three independent experiments. *P < 0.05; n.s. not significant (relative to untreated cells), one sample t test. b Survival curves for recipient mice transplanted with shSCR.1 (dashed lines) and shRuvbl2.2 (solid lines) clones, untreated (black lines, n = 2 for shSCR.1 and n = 5 for shRuvbl2.2) or treated with doxycycline (red lines, n = 4 for shSCR.1 and n = 7 for shRuvbl2.2). Red arrow indicates point at which doxycycline treatment started. P = 0.0002 for doxycycline treated versus untreated shRuvbl2 mice, logrank (Mantel-Cox) test. c Apoptosis induction in inducible control (CON) and human RUVBL2(DN) mouse MLL-ENL clones 48 hours after doxycycline treatment. Bars and error bars represent means and SD of fold changes in apoptosis from three independent experiments. *P < 0.05; n.s. not significant (relative to untreated cells), one sample t test. d Survival curves for recipient mice transplanted with CON (dashed lines) and RUVBL2(DN).1 (solid lines) clones, untreated [black lines, n = 3 for CON and n = 6 for RUVBL2(DN).1] or treated with doxycycline [red lines, n = 3 for CON and n = 7 for RUVBL2(DN).1]. Red arrow indicates point at which doxycycline treatment started. P = 0.0005 for doxycycline treated versus untreated RUVBL2(DN) mice, logrank (Mantel-Cox) test. e Percentages of total (hCD2+CD45.1+), myeloid (hCD2+CD45.1+CD11b+GR1+) and B lymphoid (hCD2+CD45.1+CD19+B220+) transduced donor cells in the bone marrow and spleen of recipient mice, four months after reconstitution with mouse HPC, transduced with control (CON) or RUVBL2(DN) expressing lentiviral vectors. Bars and error bars are means and SD of percentages from three control and five RUVBL2(DN) mice. n.s. = not significant, unpaired Student’s t test.

