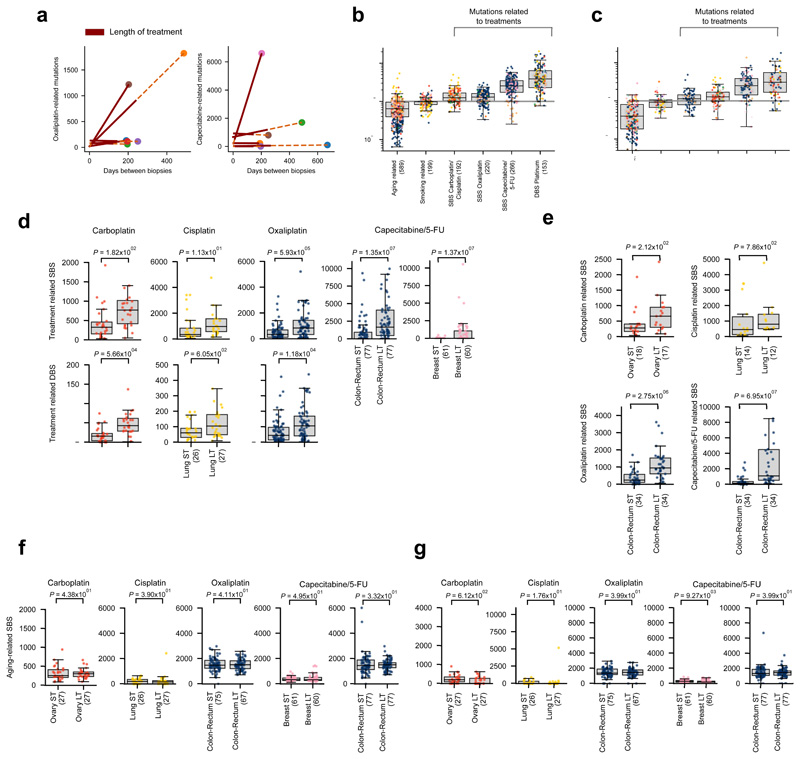
Extended Data Fig.7. Selection of coherent tumors according to the activity of signatures attributed by both extraction methods.
Left panels show the agreement of both methods in the attribution of the activity of treatment-associated signatures across tumors. Each pair of circles connected by a line represents the exposure attributed by both methods to a tumor. Red circles represent the exposure attributed by SigProfiler, while blue circles represent the exposure attributed by SignatureAnalyzer. Middle panels show the correlation (with Pearson’s r) between the exposure attributed by both methods to all tumors, while right panels present the correlation (with Pearson’s r) of the exposure attributed by both methods to coherent tumors (difference between relative exposures lower than 0.15).

