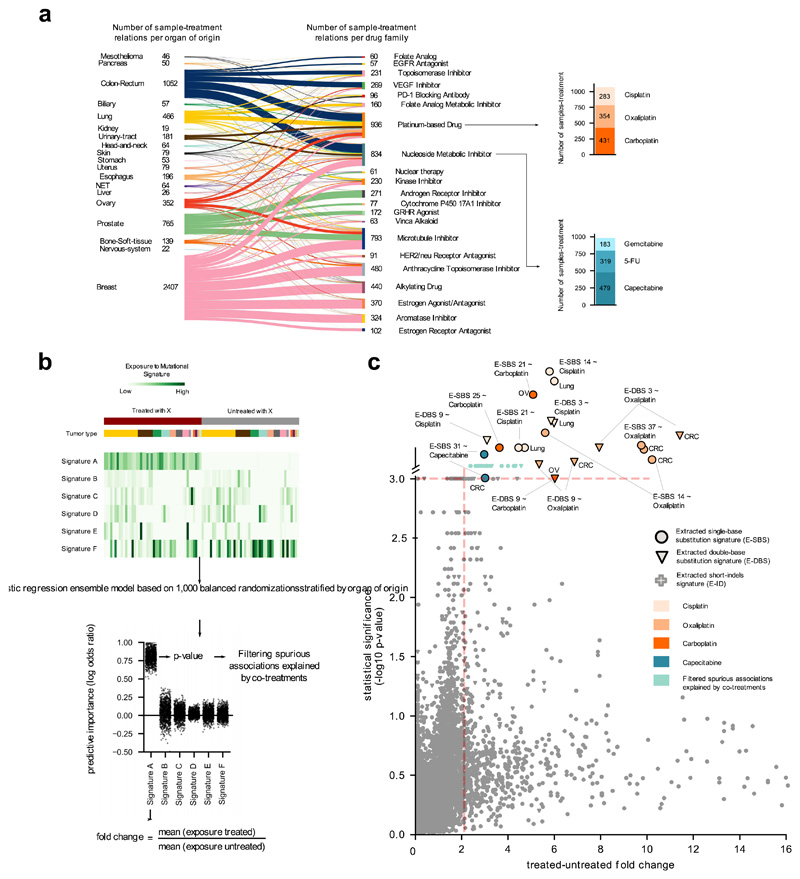
Figure 2. Mutational signatures associated with anti-cancer treatments.
(a) Distribution of treatments administered to donors in the metastatic cohort, grouped by organ of origin of the primary and FDA family. Stacked barplots at the right: number of metastatic tumors exposed to two example drugs. Due to complex regimens, donor-therapy pairs counted add up to more than the total number of tumors in panel b.
(b) Schematic representation of the ensemble regression model (Methods). Tumors from different organs (colors immediately above the heatmap) may be exposed or not to a treatment (X). One thousand balanced subsets of tumors exposed and not exposed to X are randomly sampled from this matrix stratified by organ of origin and then classified using a logistic regression. The effect size of the regression model for each signature is computed as the fold change between the mean exposure of treated and untreated tumors. The results are filtered to discard spurious associations explained by co-treatment regimens.
(c) Treatment-associated mutational signatures (extracted with SignatureAnalyzer). Each dot represents one of the 7,465 signature-treatment pairs tested. Associations deemed significant (effect size > 2 and p-value < 0.001) not explained by co-treatments are highlighted. Associations are detected in organ-specific regressions or through the analysis of the entire metastatic adult cohort. The carboplatin-associated signature in ovary and the capecitabine- associated signature in colorectal are “rescued”, as they appear very close to significance (p-value = 0.001). Full results are in Supplementary Table 1 and Supplementary Datasets.

