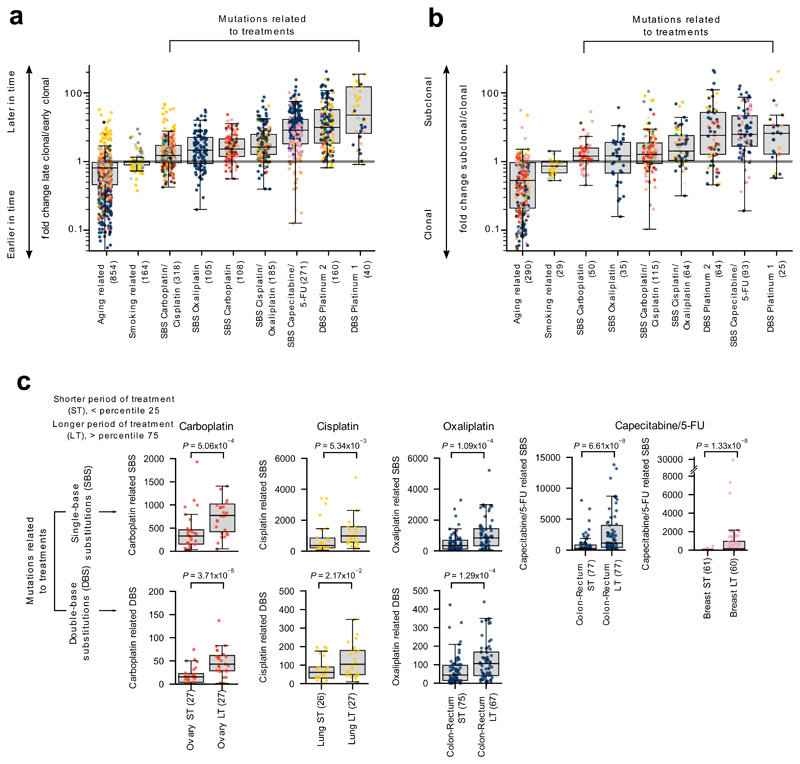
Figure 4. Characteristics of treatment-associated mutations.
(a) Mutations contributed by signatures associated with treatments are enriched for later clonal substitutions (higher late-to-early clonal mutations fold change), in comparison to signatures that are active earlier or throughout the lifetime of patients (e.g., aging and smoking-related signatures). Each tumor is represented as a dot colored following the code of organ-of-origin presented in Figure 1a. In these and all other boxplots in subsequent figures, the box delimits the second and third quartiles (separated by the line representing the median) and the whiskers show the rest of the distribution, except outliers.
(b) Mutations contributed by signatures associated to treatments are also enriched for subclonal substitutions in comparison to signatures active earlier or throughout the lifetime of patients.
(c) Higher mutation load contributed by treatment-associated signatures (extraction with SignatureAnalyzer) in patients with longer periods of treatment. Comparison of the distribution of the number of SBS (upper row) and DBS (lower row) of signatures associated with each drug in tumors from patients with shorter period of treatment (ST - low quartile) and patients with longer period of treatment (LT - high quartile). Tumors of organ of origin with sufficient mutations to carry out the comparison are shown. In every case, LT tumors possess significantly more mutations than ST tumors (one-tailed Mann-Whitney test).

