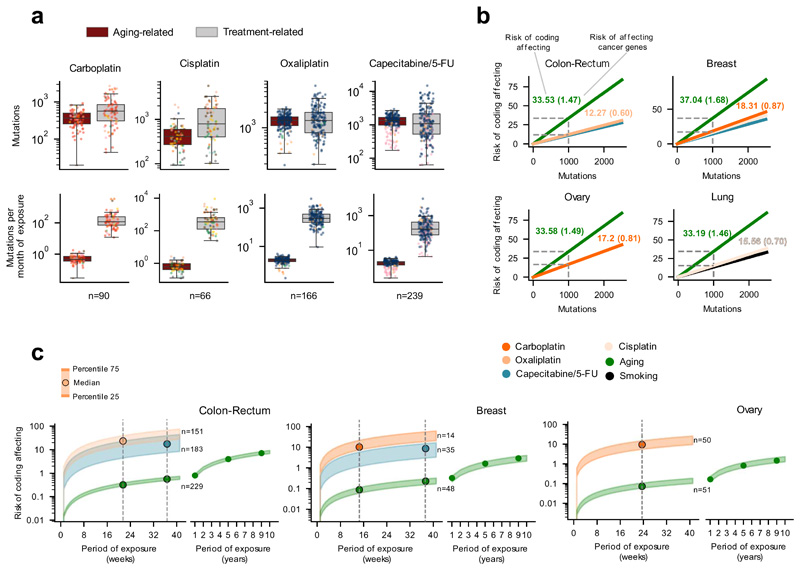
Figure 6. The mutational risk of anti-cancer treatments.
(a) Contribution (in total or averaging per month of exposure) of treatment-associated signatures and the aging signature to the mutation burden of metastatic tumors. Each tumor is represented as a dot colored following the code of organ-of-origin presented in Figure 1b.
(b) Risk (number of mutations) of several signatures of producing coding-affecting mutations estimated from their contribution to the mutation burden of tumors (Methods). Lines corresponding to tumors originated in different organs represent the linear relationship between the total contribution of signatures and their coding-affecting risk. Dashed lines mark the coding-affecting risk (spelled-out by numbers above the lines) for a contribution of 1,000 mutations. In parentheses, risk of signatures of causing mutations affecting known cancer genes31 (Methods).
(c) Risk of coding affecting mutations contributed by different signatures according to the duration of the exposure to the associated drugs. Risk values are represented as a range spanning between the 25th and the 75th percentile of the distribution of contribution of signatures to the burden of tumors in four weeks of exposure (panel a). Vertical lines intersecting these risk value ranges are placed at the median of the distribution of times of exposure of all tumors of the given organ or origin to a given drug. The range of values of risk for the mutations contributed by the aging signature is extended several years to the right of the graph.

