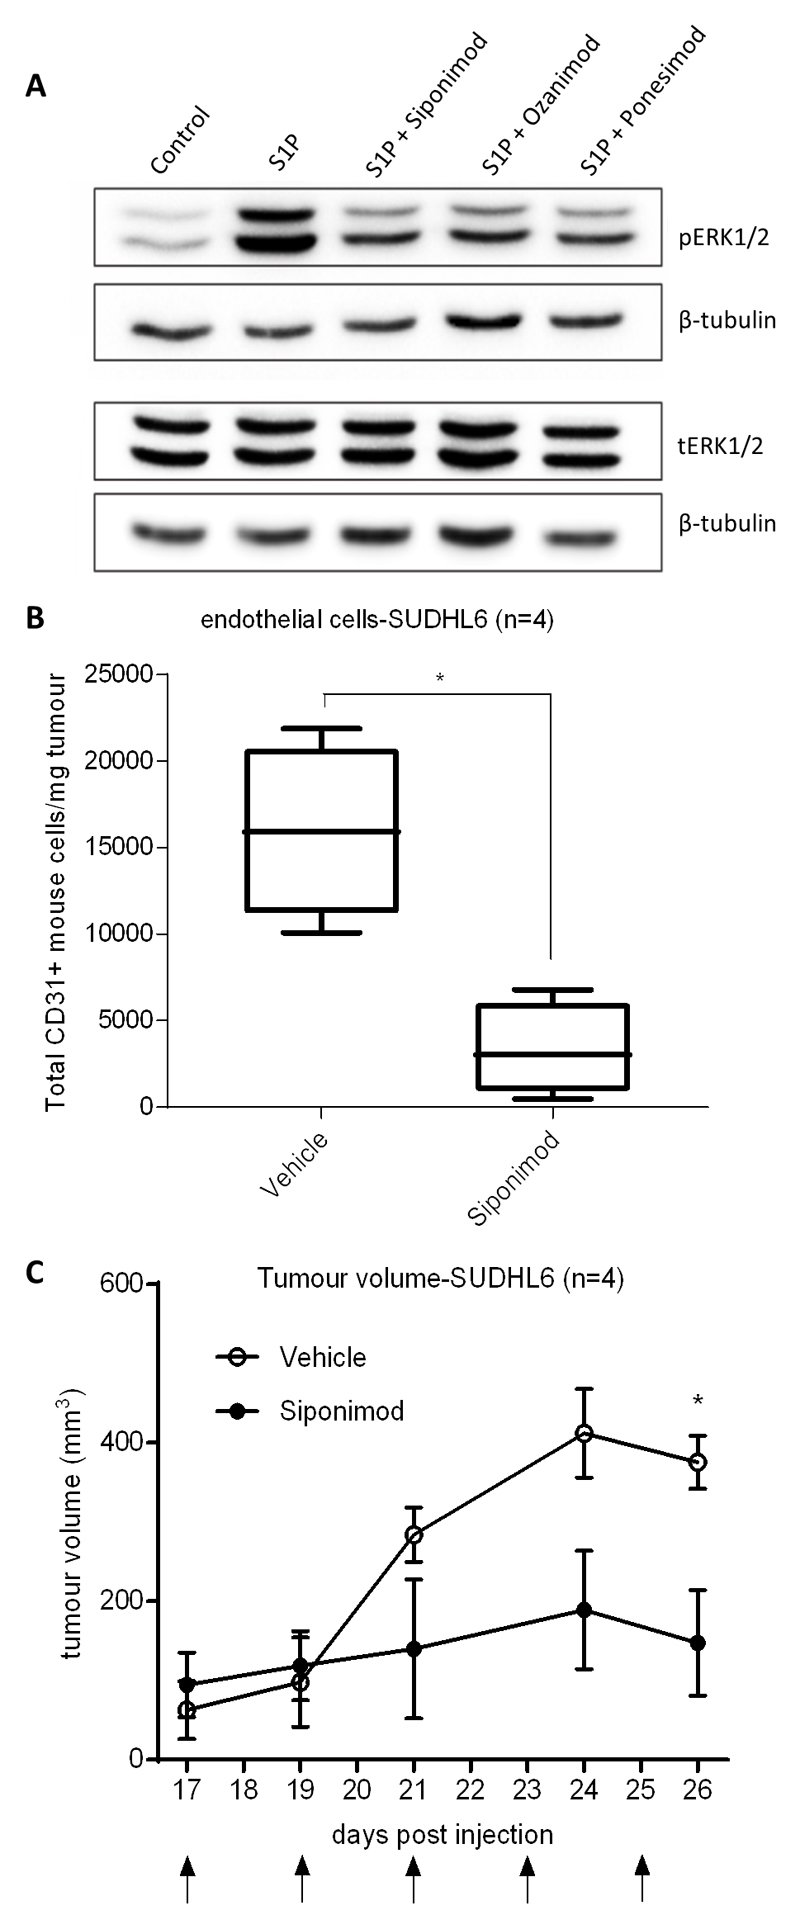
Figure 6. S1PR1 inhibition decreases S1P-induced signalling and reduces angiogenesis in a mouse model of DLBCL.
(A) Immunoblot of HUVEC pre-treated for 1h with 100nM of S1PR1 functional antagonists, Siponimod, Ozanimod and Ponesimod and stimulated with S1P or control (S1P vehicle) for 5min. S1P or control only treated cells received the equivalent dose of DMSO (drug solvent) to S1PR1 inhibitor treated cells (0.01µl DMSO per 1mL of media). β-tubulin was used as a loading control. The same protein lysates were used to detect pERK1/2 and tERK1/2 in separate blots. Data are representative of three separate donors. (B) Flow cytometry analysis of numbers of CD31-positive mouse cells/per mg tumour of SUDHL6 xenografts in NSG mice treated with Siponimod compared with drug vehicle (4 mice for each group). (C) Tumour volumes in days after injection with SUDHL6 cells in Siponimod-treated versus vehicle-treated animals. Arrows indicate treatment days. *denotes p<0.05 in Student’s t test.

