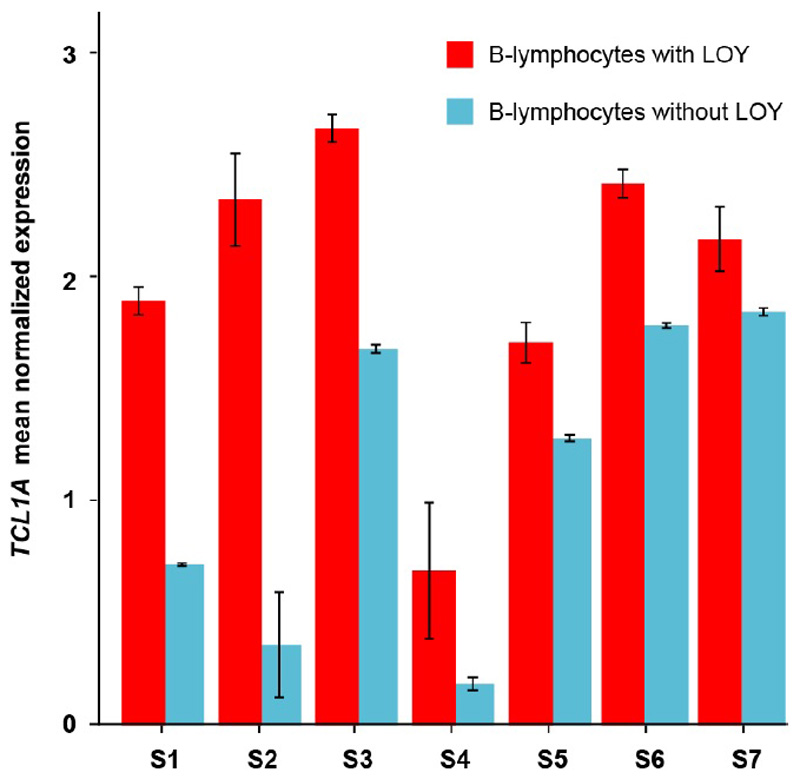
Extended Data Figure 8. Differential expression of the TCL1A gene in B-lymphocytes with (N=2,459) and without (N=277) the Y chromosome within individual subjects.
Error bars indicate the 95% confidence interval of the mean normalized expression of TCL1A within each group. To avoid stochastic effects that might occur in estimations using a small number of cells, results are shown for individuals with LOY in at least 10% of the B-lymphocytes and with LOY in more than five individual B-lymphocytes. Within each of the seven individuals (S1-S7) meeting this criteria, TCL1A showed a higher expression in the LOY cells compared to normal cells. This suggests that the observed TCL1A overexpression in B-lymphocytes without a Y chromosome is independent from the individual genotypes at the lead GWAS-SNP (rs2887399).

