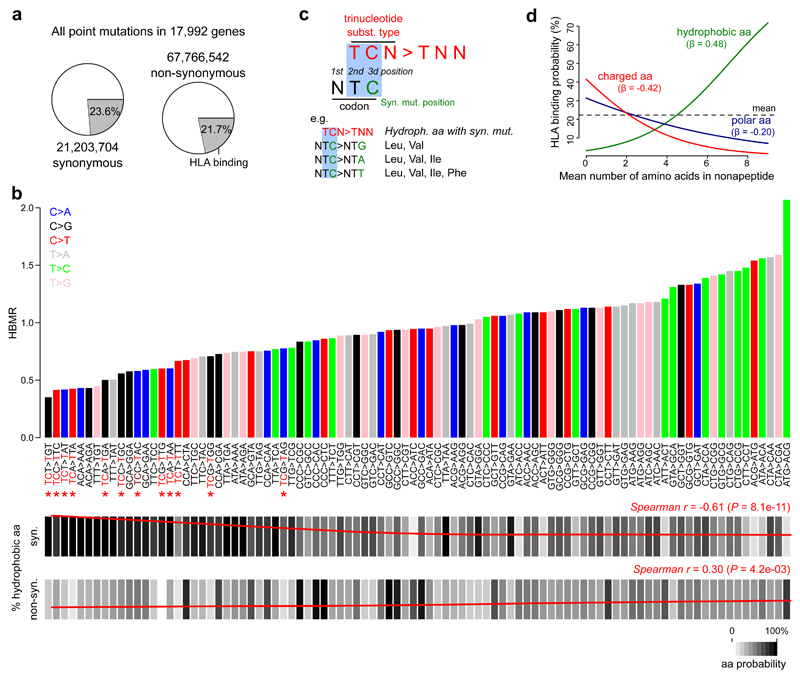
Figure 3. Association between trinucleotide substitution types and HLA-binding properties.
a, All possible synonymous and non-synonymous mutations were determined in 17,992 genes. Pie charts indicate the proportions of mutations that are located in HLA-binding regions. b, Bar plot on top indicates the expected HBMR value for each trinucleotide substitution type, determined from all possible mutations from a given type in the complete exome (numbers shown in a). Main substitution types are colored as indicated by the legend on top left. Note that HBMR values are not derivable for four trinucleotide substitution types (ATT>AAT, ATT>AGT, ACT>AGT and ACT>AAT) due to the absence of synonymous mutations resulting from these substitution types (e.g. an ATT>AAT substitution can never be synonymous). TCN>TNN substitutions are indicated by red asterisks. Below the bar plot, the frequency of synonymous and non-synonymous mutations hitting hydrophobic amino acids is indicated for each substitution type (scale indicated on bottom right). Loess regression line in red with Spearman correlation coefficient (r) and P value indicated on top right (correlation between HBMR and mutation frequency for 92 different substitution types). c, Illustration of TCN>TNN mutations mainly resulting in synonymous mutations in hydrophobic amino acid codons. d, Logistic regression line indicating the correlation between a nonapeptide’s mean number of hydrophobic/charged/polar amino acids (0 to 9) and the HLA-binding probability. Regression coefficients (β) are given for each amino acid class. The mean number of amino acids for each class was determined for 1 million random exome locations (9 nonapeptides per position) to make the analysis comparable to the other analyses. A similar analysis on individual nonapeptides is shown in Supplementary Figure 10.

