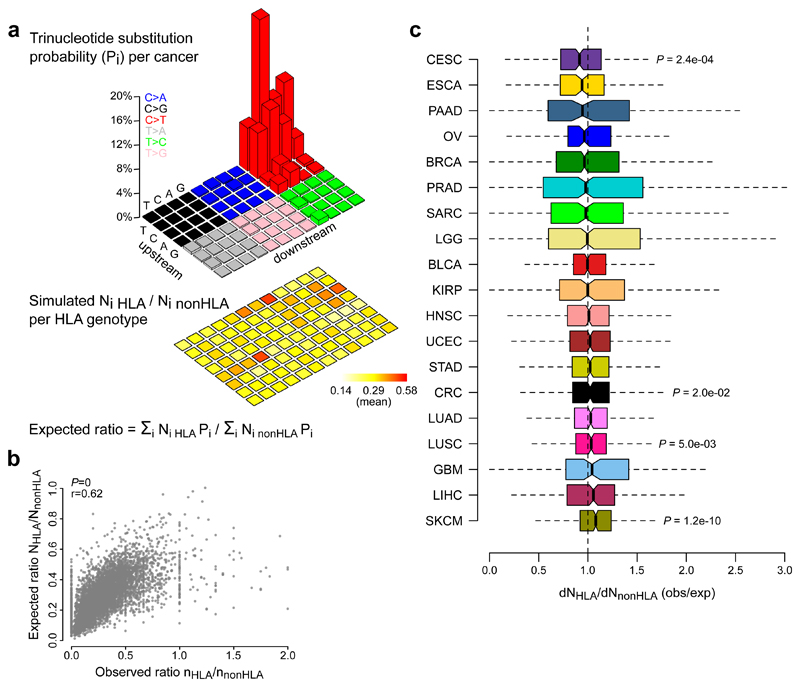
Figure 5. An HLA genotype-specific analyses of mutated peptides confirms the absence of neoantigen depletion signals in most tumor types.
a, Methodological approach. For each trinucleotide substitution type (i), 10,000 mutations were randomly simulated (960,000 mutations in total). The expected number of non-synonymous mutations in HLA-binding and non-binding peptides were derived for each substitution type considering the mutated peptides’ HLA affinities for the sample-specific HLA genotype (heatmap on bottom). From these numbers, the expected ratio between non-synonymous mutations in HLA-binding and non-binding peptides was calculated using the substitution probabilities of the corresponding cancer type (legoplot on top). b, Scatter plot shows the correlation between observed and expected ratios, with Pearson correlation coefficients (r) and P values indicated on top left. c, dNHLA/dNnonHLA values were calculated for each TCGA sample and grouped by tumor types. Boxplots indicate median values and lower/upper quartiles with whiskers extending to 1.5x the interquartile range. Two-sided Wilcoxon signed-rank test was used to test deviation from 1. P values are given for cancers with q values below 0.1. Mutations in cancer driver genes or non-expressed genes were excluded. See Supplementary Table 1 for cancer type abbreviations and sample sizes and Supplementary Table 2 for detailed results.

