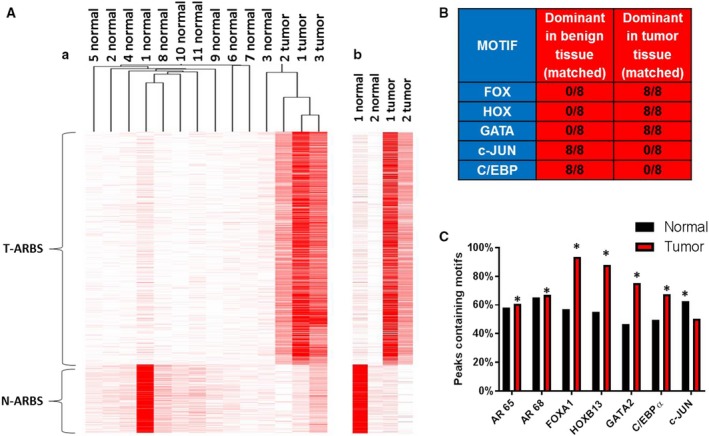
Figure 1.

Discovering and defining components of the AMS. Using our bioinformatics methods, we reanalyzed the data from the Pomerantz samples along with our new samples. (A) Unsupervised hierarchical clustering of ARBS enrichment demonstrates a segregation of normal from tumor samples. A side‐by‐side comparison of our two matched samples is also shown. (B) Motif discovery was performed on all matched samples. Shown is a summary of indicated motifs in benign and tumor sections of the samples. (C) The percentage of motifs of specific TF family members were quantified in normal and tumor peaks. Statistical analysis of motif enrichment between groups was by chi‐square test using r software environment, and a P‐value of > 0.05 was considered significant as indicated by a *.
