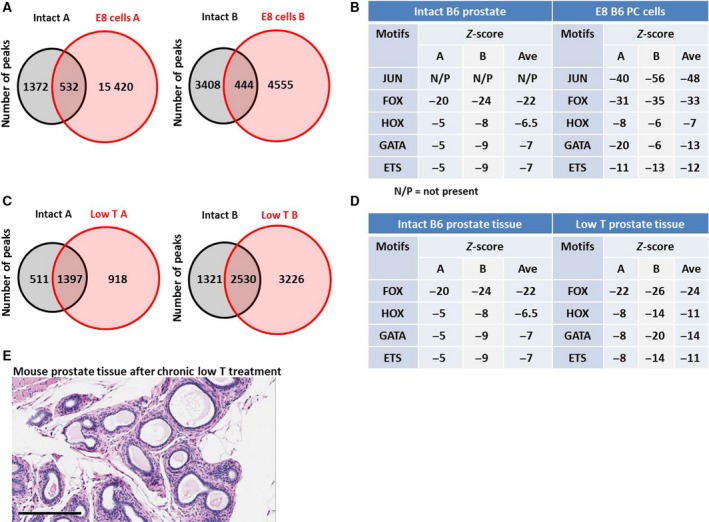
Figure 5.

The AMS is present in in vitro and in vivo mouse models. AR ChIP‐seq was performed on E8 cells, which were derived from a hormone‐sensitive tumor from a Pten−/− mouse from a B6 background, on prostate tissue from healthy B6 mice, or on prostate tissue from B6 mice treated for 6 weeks with low T. Venn diagrams of shared and unique peaks compared to healthy prostate controls (A, C) demonstrate an expansion of ARBSs in each duplicate from both comparisons. Cistrome was used to determine the enrichment of TF family motifs in each sample, where a more negative z score indicates greater enrichment (B, D). (E) B6 mice were treated with low T for 18 months (n = 9); then, prostates were removed and examined histologically. No adenocarcinomas were detected in any mouse. Scale bar = 200 µm.
