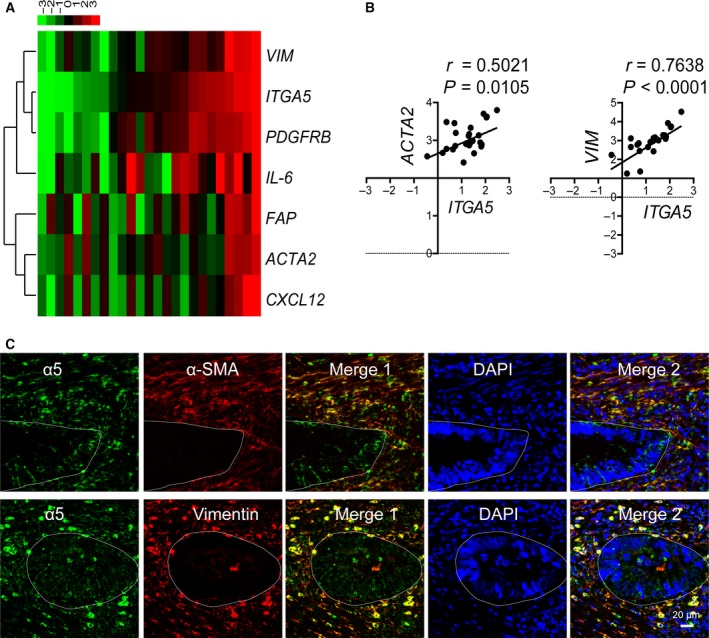
Figure 2.

Expression of α5 was positively correlated with CAF markers in human colorectal adenocarcinomas. (A) Heatmap of the mRNA levels of ITGA5 and CAF marker genes in 24 fresh colorectal adenocarcinoma samples evaluated by qPCR. Each row represents a gene and each column represents a case. Cases were organized from left to right by the ascending order of ITGA5 expression level. Data were normalized to median and log2 values were used. The dendrogram was drawn with the hierarchical clustering method. The color scheme representing gene expression levels (row Z‐score) was illustrated above the heatmap. (B) Pearson’s correlation between the expressions of ITGA5 and CAF marker genes (ACAT2 and VIM) in 24 fresh colorectal adenocarcinoma samples. Expression was determined by qPCR in triplicate. (C) Representative double immunofluorescent staining of α5 (red) and CAF markers (α‐SMA or vimentin; green) with DAPI (blue nuclei) in the clinical samples with colorectal adenocarcinomas. Scale bar: 20 μm. White lines delimitate the area of tumor epithelial cells.
