Figure 4.

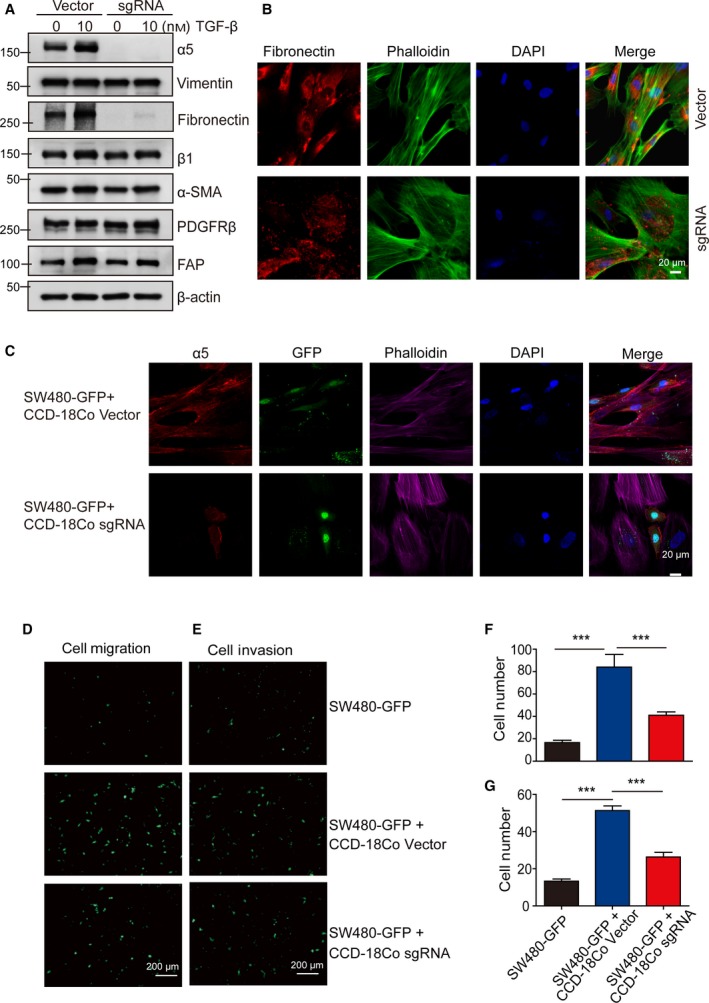
α5 Depletion downregulated fibronectin assembly in fibroblasts and showed reduced effects on promoting cancer cell migration and invasion. (A) Expression levels of α5 and selected markers were determined by western blotting in CCD‐18Co vector cells and CCD‐18Co sgRNA cells with or without TGF‐β activation. β‐Actin served as loading control. A representative result of three independent experiments is shown. (B) Immunostaining of fibronectin (red) in CCD‐18Co vector cells and CCD‐18Co sgRNA cells. F‐actin is stained with phalloidin‐647 (red) and DNA was stained with DAPI (blue). Scale bar: 20 μm. (C) α5 Depletion in fibroblasts affected cancer cell morphology in the coculture system. Representative images of SW480‐GFP cocultured with control fibroblasts (CCD‐18Co vector) or with α5‐depleted fibroblasts (CCD‐18Co sgRNA). The α5 was shown in red, F‐actin was stained with phalloidin‐647 (purple) and DNA was stained with DAPI (blue). Scale bar: 20 μm. (D–G) The α5 depletion in fibroblasts showed reduced effects on promoting cancer cell migration and invasion compared with the wild‐type fibroblasts. SW480‐GFP cells were cultured alone or cocultured with CCD‐18Co vector control cells or with α5‐depleted CCD‐18Co cells (CCD‐18Co sgRNA) in Transwell inserts with or without Matrigel. (D,F) Serum‐induced Transwell migration calculated after 16 h. SW480‐GFP cells migrating to the lower chamber were observed under a fluorescence microscope and were counted. Scale bar: 200 μm. (E,G) Serum‐induced cell invasion calculated after 22 h. SW480‐GFP cells that invaded through the Matrigel to the lower chamber were observed under a fluorescence microscope and were counted. Scale bar: 200 μm. Error bars, SEM (n = 3). ***P < 0.001 (one‐way ANOVA).
