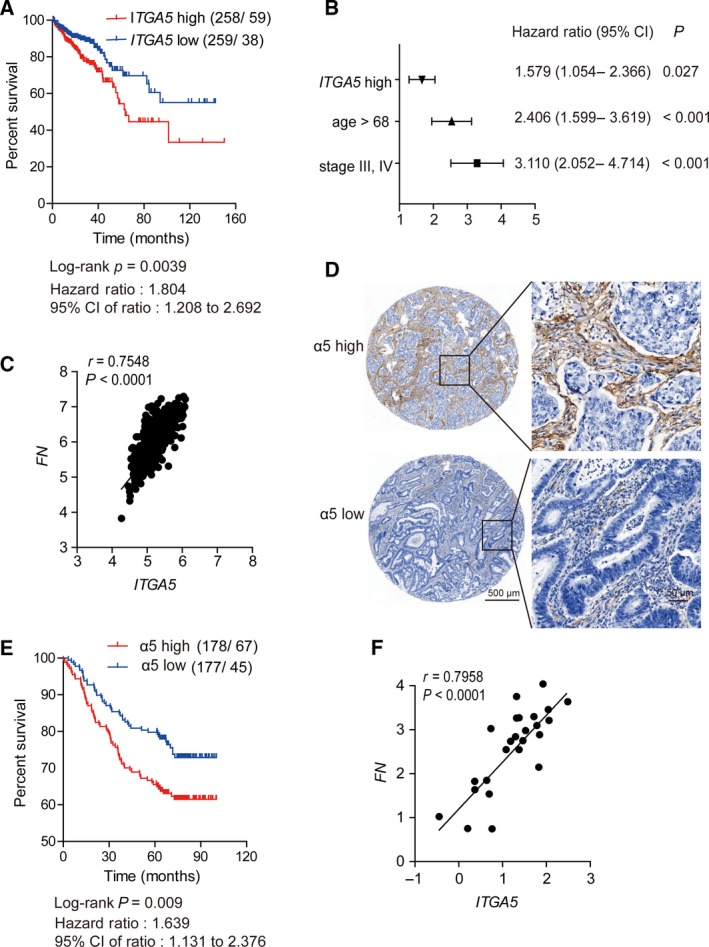
Figure 5.

The α5 integrin expression predicted OS and was positively correlated with fibronectin expression in colorectal adenocarcinoma. (A) Kaplan–Meier curve of the OS of the patients with colorectal adenocarcinoma stratified by ITGA5 expression in TCGA cohort. OS was analyzed with Kaplan–Meier curve and log‐rank test. (B) Cox multivariate regression shows that the stage and age of ITGA5 expression were independent prognostic predictors (P < 0.05) in colorectal adenocarcinoma of TCGA cohort. Main effects are shown as hazard ratios with 95% confidence intervals. (C) Pearson’s correlation between the expressions of ITGA5 and FN in 517 colorectal adenocarcinomas extracted from TCGA database. (D) Representative IHC staining (TMA section) of high or low α5 expression in an independent colorectal adenocarcinoma cohort (n = 355). Scale bar (left): 500 μm. Right, magnified views of the regions in the black box. Scale bar: 50 μm. (E) High expression of α5 was associated with poor prognosis in TMAs of colorectal adenocarcinoma. (F) Pearson’s correlation between the expressions of ITGA5 and FN in 24 fresh colorectal adenocarcinoma samples. Expression was determined by qPCR in triplicate.
