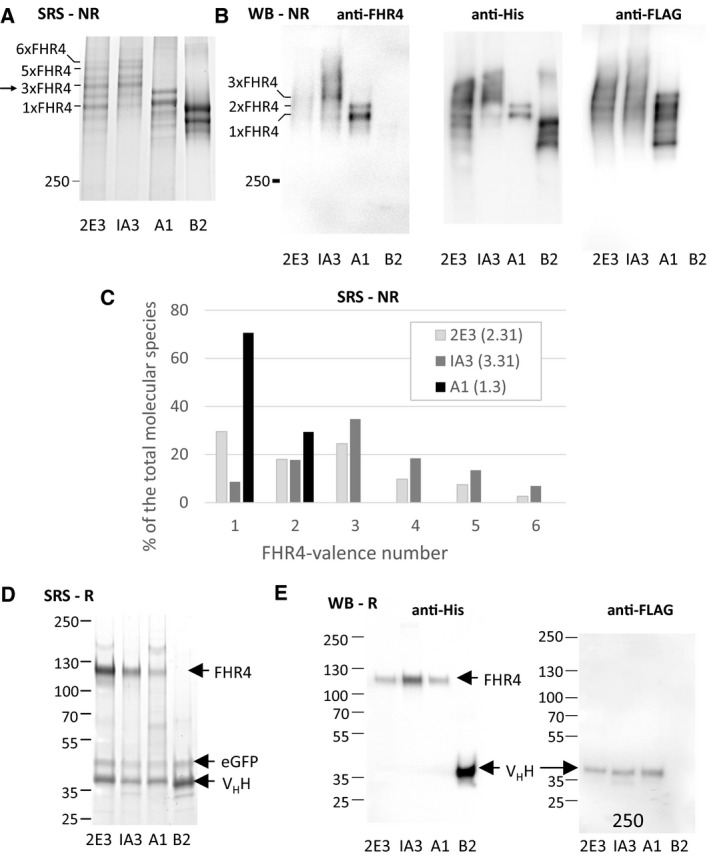
Figure 3.

Analysis of the molecular patterns of purified A1, 2E3 and IA3 multimers using SRS or WB with anti‐FHR4, anti‐His or anti‐Flag antibodies under nonreducing conditions (NR, A, B, C) or under reducing conditions (R, D, E). (A, B) IA3 multimers display molecular species with higher FHR4 valences than their 2E3 counterparts. A1 low‐FHR4 valence multimers display two main bands that correspond to 1x and 2xFHR4 molecular species. B2 control multimers display two lower bands, both lacking FHR4, and corresponding to the 7α1β and 6α1β molecular species, with the VHH anti‐HER2 and eGFP functions being fused to C4bpα and C4bpβ, respectively. A lower third band, much less represented (~ 6% of the total), could correspond to a multimeric molecular species lacking eGFP function. (C) The percentages of each molecular species within the 2E3, IA3 and A1 multimers are shown by using the method of the calculation of the area under the curve. (D) SRS under reducing conditions showed each function as a monomer: FHR4, VHH anti‐Her2 and eGFP of 120, 40 and 50 kDa molecular weight, respectively. The band corresponding to FHR4 is absent for clone B2 which lacks FHR4 function. (E) WB under reducing conditions. Using the anti‐His Ab, FHR4.C4bpα.His8x function was illuminated for 2E3, IA3 and A1, but not B2 which lacks FHR4 (e left). Instead, the 2D3 VHH.C4bpα.His function was revealed in B2 (e left, lane 4). At same protein concentration, the band was stronger for IA3 – when compared to 2E3 and A1 – which harbours higher FHR4 valence. When using the anti‐FLAG Ab, the VHH anti‐HER2.C4bpα.FLAG function was revealed for 2E3, IA3 and A1, but not B2, which harbours a His tag.
