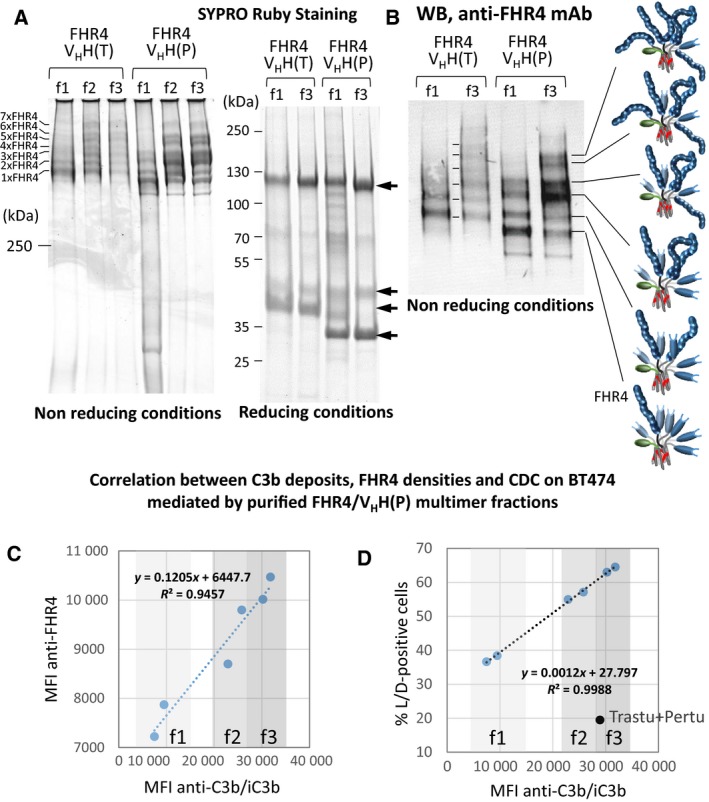
Figure 4.

FHR4/VHH(T) or FHR4/VHH(P) multimer‐containing cell culture supernatants were purified using His‐Trap and FPLC chromatography and a three‐step elution was then performed. The first step using 120 mm imidazole, the 2nd and 3rd steps using 1 m imidazole with an at least 2 h‐stop in‐between the last two steps. Pooled collected fractions from each step are called f1, f2 and f3, respectively. (A) SRS analysis of f1–f3 fractions of purified FHR4/VHH(T) or FHR4/VHH(P) multimers under nonreducing (NR; left) and reducing (R; right) conditions. f1 contains mainly low‐FHR4 valence molecular species (1x and 2x FHR4), as well as contaminants. f2 and f3 display relative similar patterns, with higher FHR4‐valence molecular species, notably 3x–6xFHR4. Under reducing conditions, top‐down reduced bands (arrows) correspond to FHR4.C4bpα.His, eGFP.C4bpβ, VHH(T).C4bpα.FLAG and VHH(P).C4bpα.FLAG monomers, displaying apparent MW 120, 50, 40 and 33 kDa, respectively. (B) WB analysis under NR of f1 and f3 from FHR4/VHH(T) or FHR4/VHH(P) multimers using a mouse anti‐human FHR4 mAb confirmed the SRS analysis; f1 fractions contain lower FHR4‐valence molecular species. (C, D) Correlation between C3b deposition, mean FHR4 densities and CDC on BT474 cells mediated by purified FHR4/VHH(P) multimer fractions. BT474 cells were incubated with saturating concentrations of f1 to f3 (20 µg·mL−1) from two different FHR4/VHH(P) purifications, then with 30% NHS at 37 °C. Cells were analysed by flow cytometry for mean FHR4 densities, C3b deposition and CDC. (C) Correlation between mean FHR4 densities and C3b deposition. (D) Correlation between the percentage of dead cells (i.e., live/dead‐positive cells) and C3b deposition. The black dot represents the comparison with the use of combined trastuzumab and pertuzumab, showing the same range of C3b deposition as f3, but a far weaker cell death.
