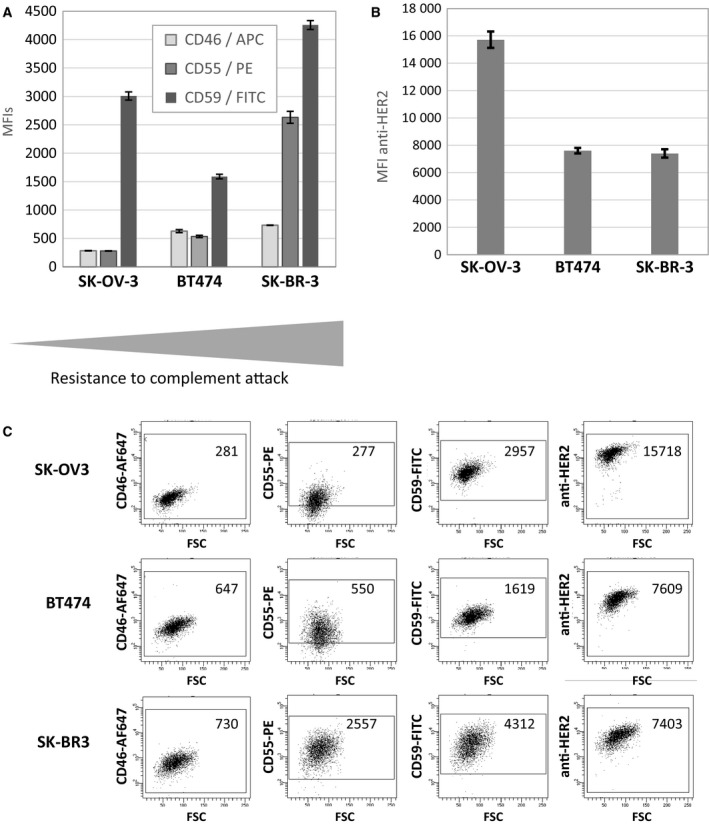
Figure 6.

mCRP (A) and HER2 (B) relative densities in SK‐OV3, BT474 and SK‐BR3 tumour cell lines as determined by flow cytometry. (A) CD46‐APC, CD55‐PE and CD59‐FITC Abs were coincubated with the cells lines. (B) Trastuzumab was incubated at saturating concentrations with the cells and its binding was revealed with an APC‐conjugated anti‐human IgG. (C) Dot plot representation of CD46, CD55, CD59 and HER2 MFI on SK‐OV3, BT474 and SK‐BR3 HER2‐overexpressing tumour cell lines. Data are means ± SD of three experiments.
