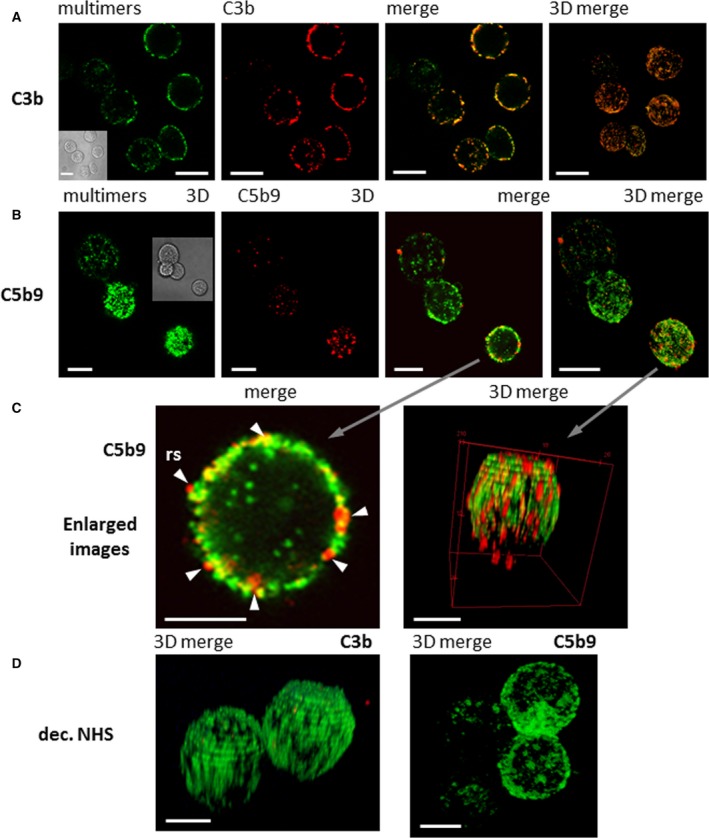
Figure 7.

Confocal microscopy analysis of FHR4/VHH(T) multimer‐mediated C3b deposition and MAC formation on BT474 cells. (A) Colocalisation of C3b deposition and FHR4/VHH(T) multimeric immunoconjugate (clone IA3). IA3 multimers on the cell surface (green) and C3b staining (red) were merged as a one‐layer section. A strong colocalisation appears as yellowish‐orange staining. The far right image is a 3D merging that represents whole cells. The scale bars represent 10 µm. (B) MAC formation analysis. FHR4/VHH(T) Multimer (green) and C5b‐9 staining (red) were merged as one‐layer sections (third picture from left), or as a reconstruction of 3D stacked‐up one‐layer sections. Bright red spots were revealed with some colocalisation with the multimers as the yellow interface. The scale bars represent 10 µm. (C) Magnification of a single cell representing the details of inserted MAC. The magnification of a single section of a merged staining from (B), showing the C5b‐9 staining of a one‐layer section (left), or a 3D reconstruction of merged staining (right). The scale bars represent 5 µm. (D) 3D reconstruction of sections with merged multimer and C3b (left) or C5b‐9 staining (right) in conditions where decomplemented NHS was used showed no staining. The scale bars represent 5 µm.
