Figure 8.

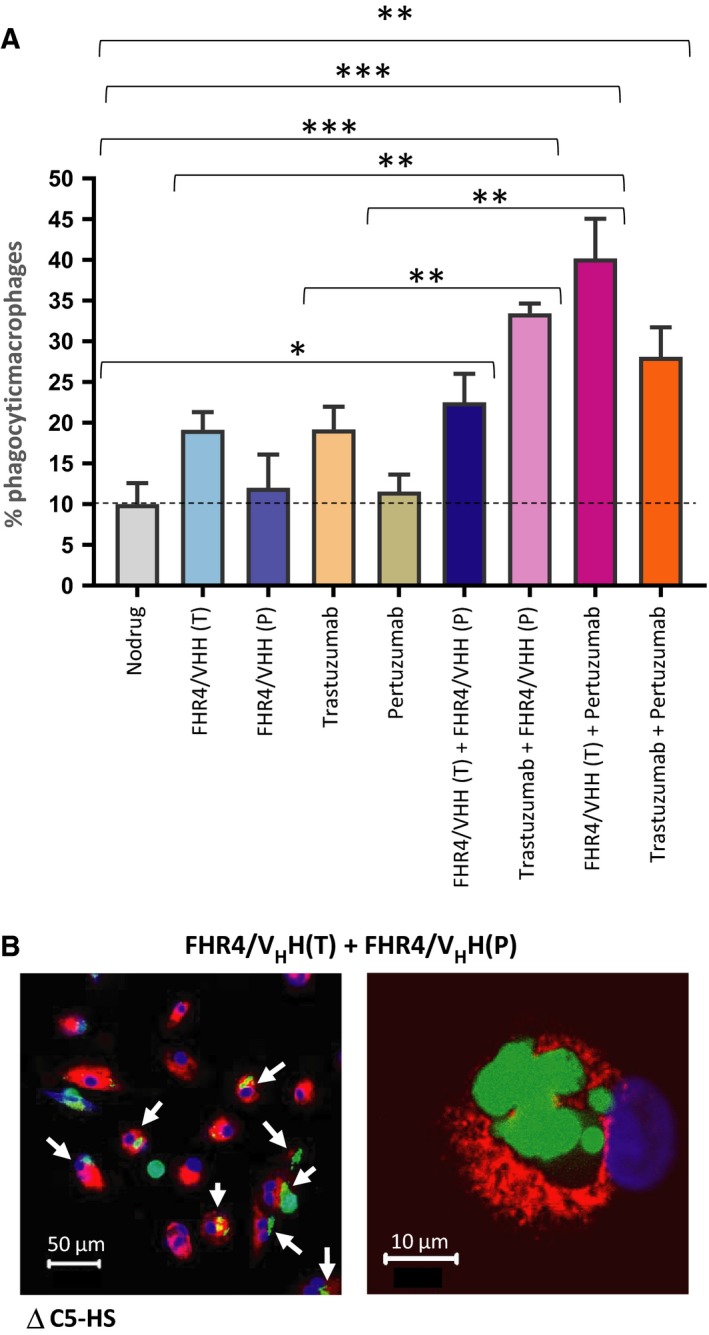
Complement‐dependent macrophage‐mediated phagocytosis of BT474 cells. (A) CFSE‐stained BT474 tumour cells were incubated with multimers and/or antibodies individually or in combination. Cells were incubated with 25% C5‐deficient human serum (∆C5HS) to prevent lysis. KPH26‐stained monocyte‐derived M2‐macrophages were then incubated with tumour cells (ratio 2 : 1) for 18 h. (A) Percentage of phagocytic macrophages was measured. Data are presented as mean values ± SD out of n = 3 series of 10 confocal images for each condition. Statistical analysis was performed using a two‐tailed paired t‐test. *P < 0.05, **P < 0.01, ***P < 0.001. (B) Left: Confocal microscopy images of phagocytosis of BT474 cells. The white arrows show the phagocytic macrophages (red) having engulfed BT474 cell(s) and harbouring a green or yellowish colour. Scale bar represents 50 µm. Right: Details of a phagocytic macrophage (red) at higher magnification (60× oil immersion). Since BT474 are poorly adherent, nonphagocytosed free‐BT474 cells are washed away during the washing step. Scale bar represents 10 µm.
