Figure 3.

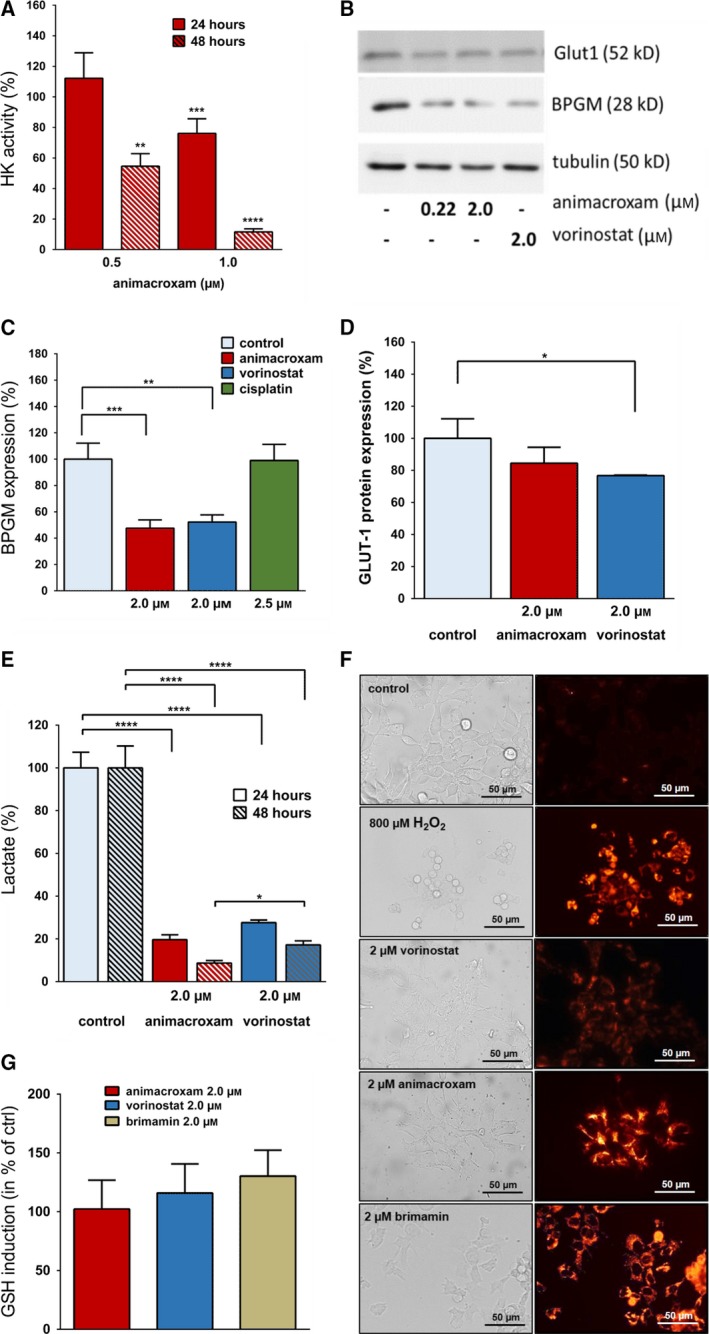
Animacroxam suppresses glycolytic activity of TGCT cells and is associated with elevated levels of ROS. (A) Time‐ and dose‐dependent reduction of HK enzyme activity in TGCT cells following incubation with animacroxam (0.5–1.0 μm) for 24 and 48 h. (B) Western blot analysis shows expression of BPGM and GLUT‐1 in TGCT cells after treatment with animacroxam or vorinostat (2.0 μm). (C) Protein quantification of BPGM expression after incubation with animacroxam, vorinostat, and cisplatin. (D) Protein quantification of GLUT‐1 expression after incubation with animacroxam and vorinostat. (E) Measurement of lactate levels in TGCT cells shows that animacroxam and vorinostat lead to a pronounced and time‐dependent repression of glycolysis after 24 and 48 h, respectively. (F) Detection of ROS in TGCT cells. Left; bright‐field images of untreated, H2O2 (800 µm), vorinostat (2.0 μm)‐, animacroxam (2.0 μm)‐, and brimamin (2.0 µm)‐treated cells. The right panel shows cellular CellROX Orange fluorescence indicating cytoplasmic ROS within the cells. H2O2 served as a positive control; scale bar = 50µm. (G) Quantification of the glutathione (GSH) production after incubation with animacroxam (2.0 µm), vorinostat (2.0 µm), and brimamin (2.0 µm). Results are shown as means ± SEM of at least n = 3 independent experiments. *P‐values of ≤ 0.05, **P‐values of ≤ 0.005, ***P‐values of ≤ 0.0005, ****P‐values of ≤ 0.0001; one‐way ANOVA post hoc Tukey’s test.
