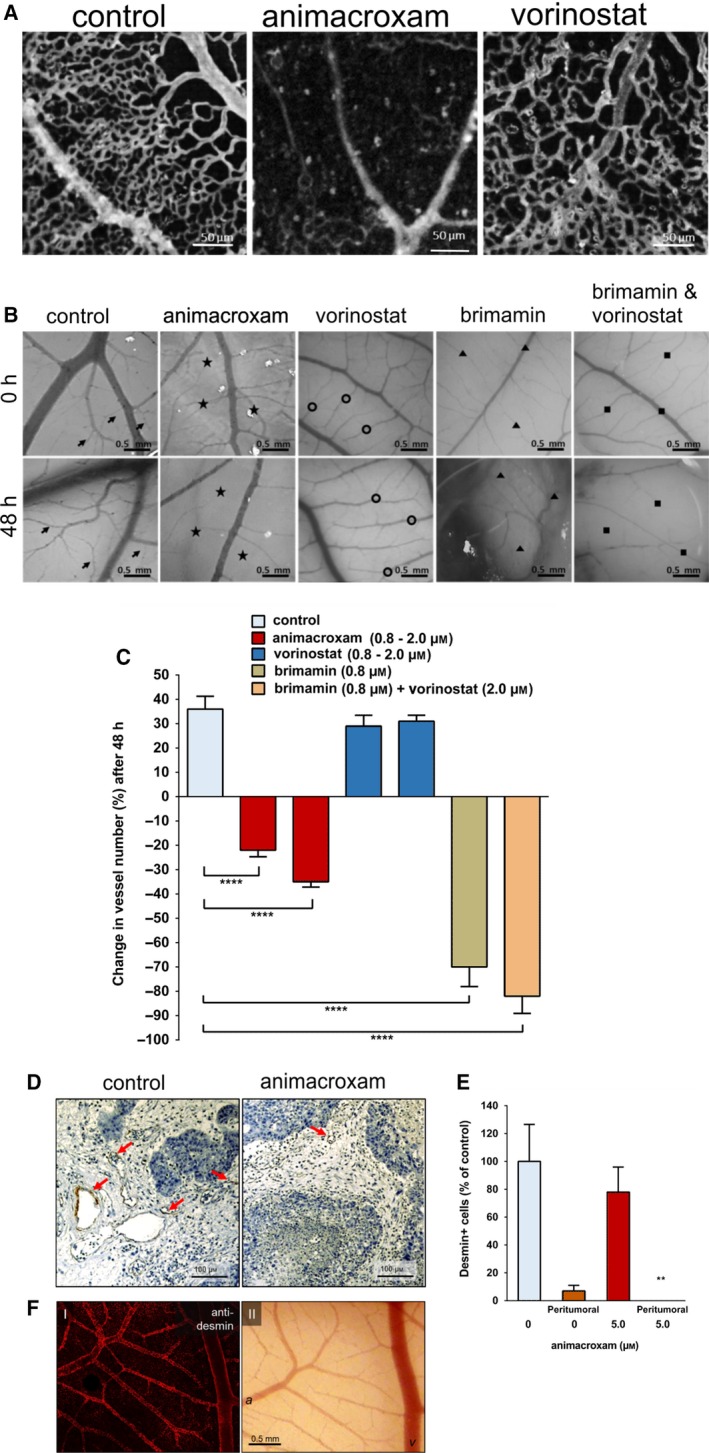
Figure 4.

Antiangiogenic and avascular effects of animacroxam and vorinostat on the CAM. (A) Representative images of the microvascular perfusion of the CAM capillary bed. Perfusion is reduced after 48 h of incubation with animacroxam (0.8 µm), but not after incubation with vorinostat (0.8 µm), when compared to PBS‐treated control; scale bar = 50 µm. (B) Images showing macrovascular network of the CAM before and after 48 h of treatment animacroxam (2.0 µm), vorinostat (2.0 µm), brimamin (0.8 µm), or brimamin (0.8 µm) combined with vorinostat (2.0 µm). Arrows indicate sprouting of vessels, stars show vessel regression, triangles show vessel disturbance, scale bar = 0.5mm. (C) Quantification of blood vessel number. (D) Desmin staining (brown) of CAM tumor plaques showed a reduction in vessel formation after animacroxam treatment. (E) Quantification of desmin‐positive cells from intra‐ and peritumoral areas of CAM tumors; scale bar = 100µm. (F) Confocal imaging of CAM blood vessels stained for desmin; scale bar = 0.5mm. (I) Desmin fluorescence is intense in the vessel wall of arteries and veins. (II) Intravital microscopy of the same CAM vascular bed used for staining a = arteries v = veins. Results are shown as means ± SEM of at least n = 3 independent preparations. *P‐values of ≤ 0.05, **P‐values of ≤ 0.005, ***P‐values of ≤ 0.0005, ****P‐values of ≤ 0.0001; one‐way ANOVA post hoc Tukey’s test in Fig. 4C and unpaired t‐test in Fig. 4E.
