
Figure 1.
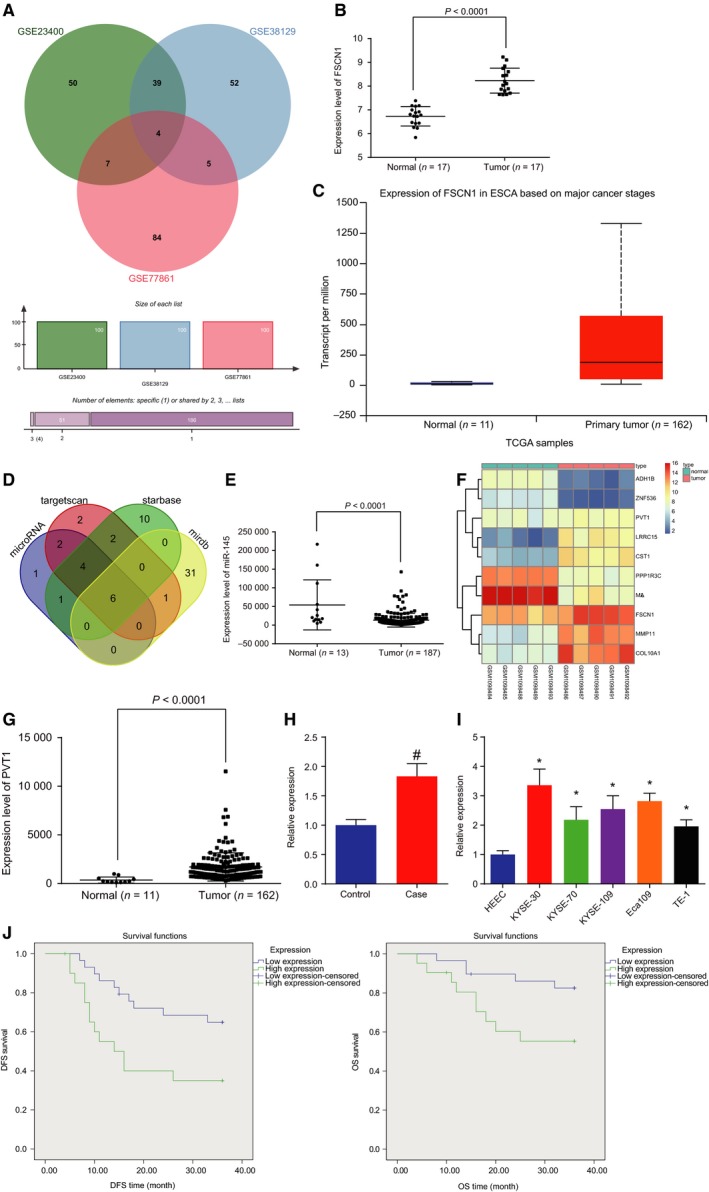
lncRNA PVT1 is highly expressed in EC tissues and cells. A, Wayne chart of top 100 differential genes of datasets http://www.ncbi.nlm.nih.gov/geo/query/acc.cgi?acc=GSE23400, http://www.ncbi.nlm.nih.gov/geo/query/acc.cgi?acc=GSE38129, and http://www.ncbi.nlm.nih.gov/geo/query/acc.cgi?acc=GSE38129; B, expression level of FSCN1 on http://www.ncbi.nlm.nih.gov/geo/query/acc.cgi?acc=GSE20347; C, expression level of FSCN1 on TCGA database; D, target of FSCN1 on four bioinformatics; E, expression level of miR‐145 on TCGA database; F, thermal map of dataset http://www.ncbi.nlm.nih.gov/geo/query/acc.cgi?acc=GSE45168; G, expression‐level scatter diagram of lncRNA PVT1 on TCGA database; H, expression of lncRNA PVT1 in cancer tissues and adjacent normal tissues detected by RT‐qPCR. Statistical values were measurement data and expressed as mean ± standard deviation. t‐Test was used to conduct data analysis, n = 50; I, expression of lncRNA PVT1 in KYSE‐30, KYSE‐70, KYSE‐109, Eca109, TE‐1, and HHEC cell lines detected by RT‐qPCR; J, the correlation between lncRNA PVT1 expression and DFS and OS analyzed by the Kaplan–Meier method (n = 50). The results were measurement data, expressed as mean ± standard deviation, and analyzed using one‐way ANOVA. The experiment was repeated three times independently; # vs. adjacent normal tissues, P < 0.05; * vs. HEEC cell lines, P < 0.05.