
Figure 7.
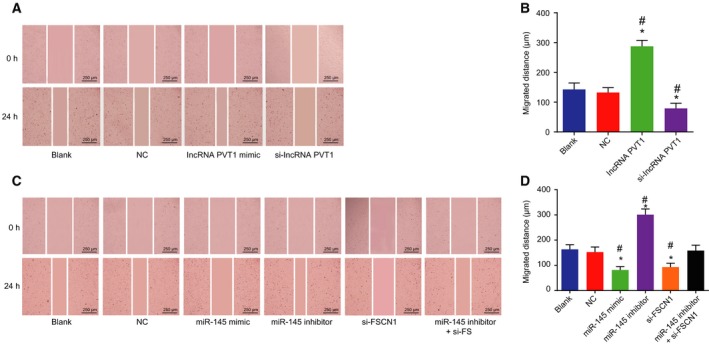
Silencing of lncRNA PVT1 and overexpressed miR‐145 hinder EC cell migration. A and B, Migration of EC cells after lncRNA PVT1 interference treatment determined by scratch test (×40, scale bar = 250 μm); C and D, migration of EC cells after miR‐145 interference treatment determined by scratch test (×40, scale bar = 250 μm). The results were measurement data, expressed as mean ± standard deviation, and analyzed using one‐way ANOVA. The experiment was repeated three times independently; * vs. the blank group, P < 0.05; # vs. the NC group, P < 0.05.