Figure 1.

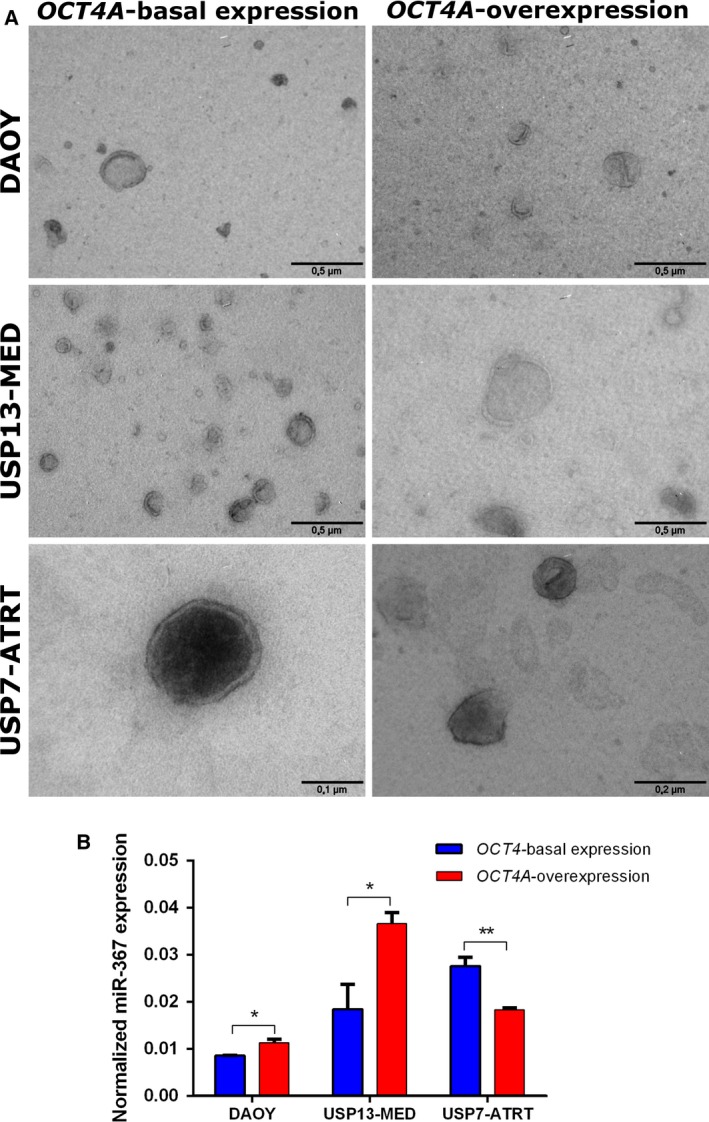
miR‐367 levels in MVs from embryonal CNS tumor cell lines. (A) Representative electron microscopy images of MVs isolated from MB and AT/RT cells, with or without OCT4A stable overexpression. Scale bars = 0.5, 0.2, and 0.1 µm. (B) Expression profile of miR‐367 in MVs isolated from embryonal tumor cell lines, with and without OCT4A stable overexpression by real‐time qPCR, using RNU58A as endogenous control. Results are expressed as mean ± SEM (*P < 0.05, **P < 0.01, t test compared with respective control condition).
