Figure 4.

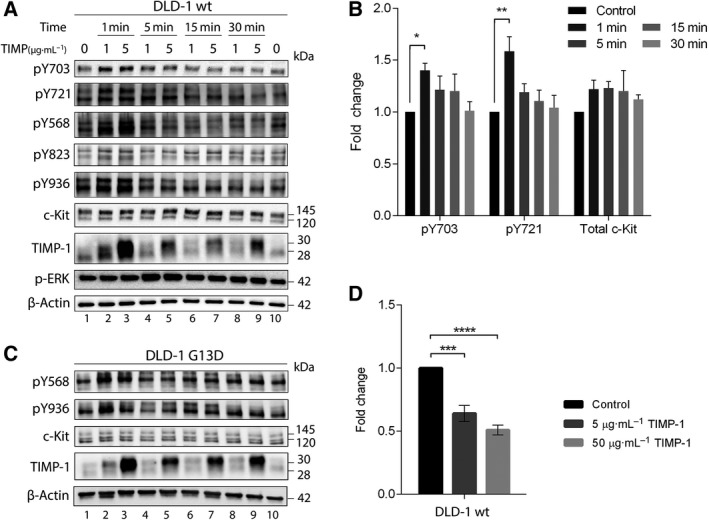
Phosphorylation of c‐Kit upon TIMP‐1 exposure. (A and C) DLD‐1 wt and G13D cells were stimulated with either 1 or 5 µg·mL−1 TIMP‐1 for the indicated time periods. Controls were treated with vehicle (PBS) for 30 min. Western blots were repeatedly stripped and probed for the different anti‐phospho‐c‐Kit antibodies recognizing various phosphorylated residues (Y703, Y721, Y568, Y823, and Y936 for DLD‐1 wt and Y568 and Y936 for DLD‐1 G13D, respectively) and finally for total c‐Kit. Blots were additionally blotted for pERK1/2 and TIMP‐1. β‐Actin was used as loading control. (B) Quantification of phosphorylated c‐Kit and total c‐Kit levels upon TIMP‐1 exposure in DLD‐1 wt cells. Quantification was performed with ImageJ. The mean fold change of c‐Kit pY703, c‐Kit pY721, and total c‐Kit levels between unstimulated and TIMP‐1‐treated samples is presented (±SEM). * indicates P < 0.05, and ** indicates P < 0.01, a two‐way ANOVA test with Dunnett’s correction for multiple comparison was used for significance. (D) Analysis of c‐Kit shedding upon exposure to TIMP‐1. Cells were stimulated for 24 h with 5 or 50 µg·mL−1 TIMP‐1 prior to collection of conditioned medium. Soluble c‐Kit levels in the medium were determined by a c‐Kit shedding‐specific ELISA kit. Bars represent the mean fold change of soluble c‐Kit levels between control and TIMP‐1‐stimulated samples (±SEM). No shed c‐Kit was detected for DLD‐1 G13D. *** and **** indicate P < 0.001 and P < 0.0001, respectively. Significance was determined by one‐way ANOVA test with Dunnett’s correction for multiple comparison.
