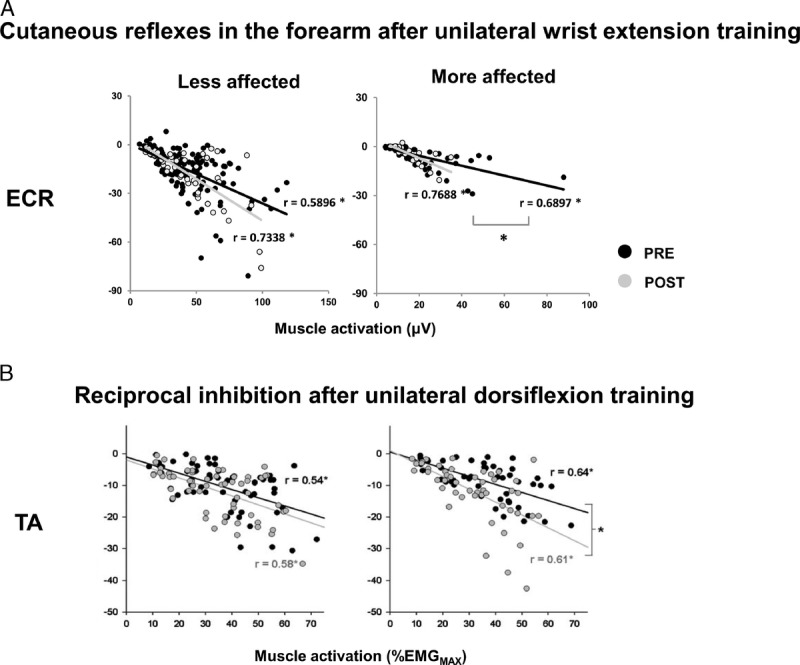
Figure 3.

Normalization of spinal interneuronal excitability after cross-education training. A. Normalized cutaneous reflexes in extensor carpi radials (ECR) evoked from superficial radial nerve stimulation (SR) at different background muscle activation levels. Black and gray dots represent reflex amplitude before (PRE) and after (POST) training, respectively. B. Normalized reciprocal inhibition in tibialis anterior (TA) muscle. Black and gray dots represent reflex amplitudes before (PRE) and after (POST) training. Data from less affected and more affected arms are shown at left and right, respectively. Linear regression analyses were performed and Pearson r values were calculated for each best-fit line. * indicates significant linear correlation. # indicates significant difference between linear regression slopes. X-axis represents background muscle activation (%EMGMAX). Y-axis represents reflexes amplitudes. Data adapted from (9,10).
