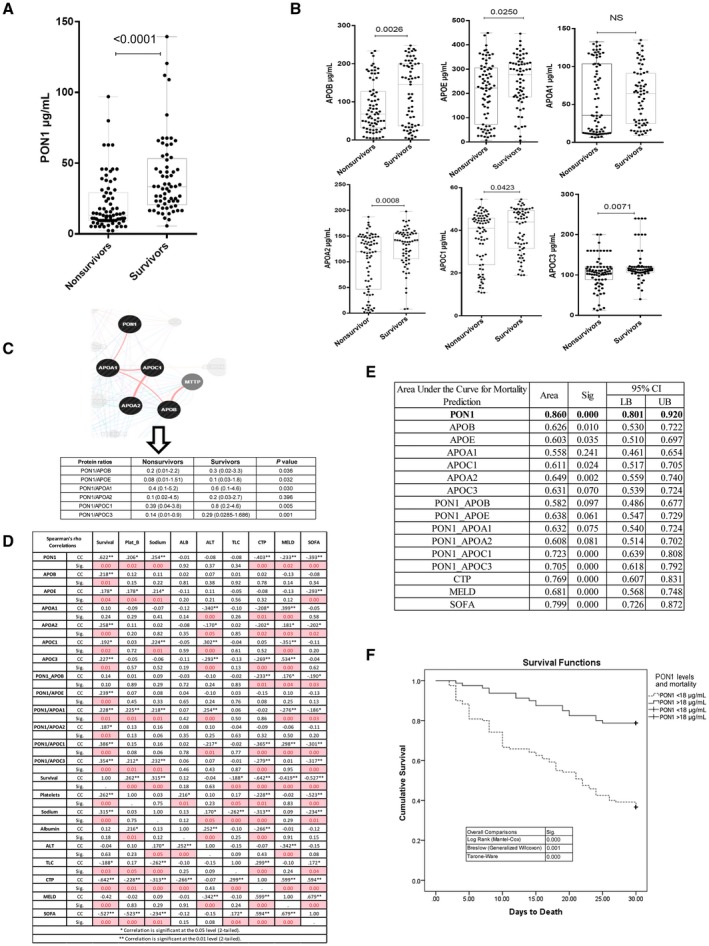
Figure 2.

Plasma levels of lipid transporter proteins correlate to severity and outcome in SAH. (A) Plasma level of PON1 was down‐regulated in nonsurvivors of SAH (median, 13.1; range, 2.3‐97) versus survivors (median, 33.4; range, 5.7‐139.4; P < 0.01). (B) Plasma levels of apolipoproteins (APOB, APOE, APOA1, APOA2, APOC1, and APOC3) in nonsurvivors compared to survivors. (C) PON1 interaction network and the levels of the ratios of PON1:lipid transporter proteins (PON1:APOB, PON1:APOE, PON1:APOA1, PON1:APOC1, PON1:APOC3) in nonsurvivors and survivors. (D) Correlation of PON1 and lipid transporter proteins with severity and outcome in SAH; pink represents P < 0.05. (E) Diagnostic efficacy of PON1 compared to other lipid transporter proteins in predicting severity and mortality in patients with SAH; P < 0.05. (F) Kaplan‐Meier survival analysis of patients with SAH based on PON1 levels of <18 μg/mL versus >18 μg/mL (log rank <0.01). Abbreviations: ALB, albumin; ALT, alanine aminotransferase; CC, correlation coefficient; CI, confidence interval; LB, lower bound; MTTP, microsomal triglyceride transfer protein; NS, not significant; Plat_B, platelet_baseline; Sig., significance; UB, upper bound.
