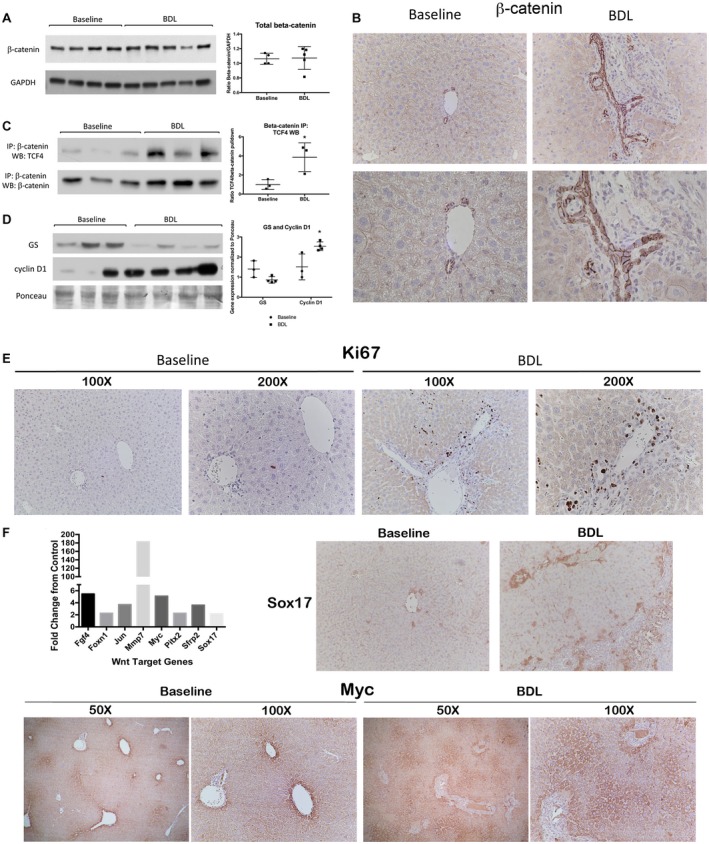
Figure 5.

A distinct set of β‐catenin target genes is activated in liver after BDL. (A) WB and quantification show no change in total β‐catenin protein expression after BDL. (B) IHC shows that at baseline β‐catenin is primarily localized to the hepatocyte membrane, while after BDL, there is cytoplasmic staining in periportal hepatocytes and an increased proportion of total β‐catenin in the cholangiocyte compartment (top row images, magnification ×200; bottom row images, magnification ×400). (C) IP shows that TCF4/β‐catenin association increases after BDL in WT livers; *P < 0.05 versus baseline (t test). (D) WB shows an increase in cyclin D1 protein expression in WT livers after BDL, while expression of GS is decreased; *P < 0.05 versus baseline (t test). (E) Ki67 IHC demonstrates that BDL induces robust proliferation of cholangiocytes and nonparenchymal cells but not hepatocytes. (F) Left: There is increased expression of several Wnt/β‐catenin target genes in WT livers after BDL. Right: Sox17 staining is increased in the periportal region after BDL (magnification ×100). Bottom: Myc expression, which is normally restricted to the central vein, expands to the mid‐zonal and periportal regions after BDL, as assessed by IHC (magnification ×100). Data in A,C,D represent mean ± SEM. Abbreviations: Fgf4, fibroblast growth factor 4; Foxn1, forkhead box N1; GAPDH, glyceraldehyde 3‐phosphate dehydrogenase; Jun, jun proto‐oncogene; Mmp7, matrix metallopeptidase 7; Pitx2, paired‐like homeodomain transcription factor 2; Sfrp2, secreted frizzled‐related protein 2.
