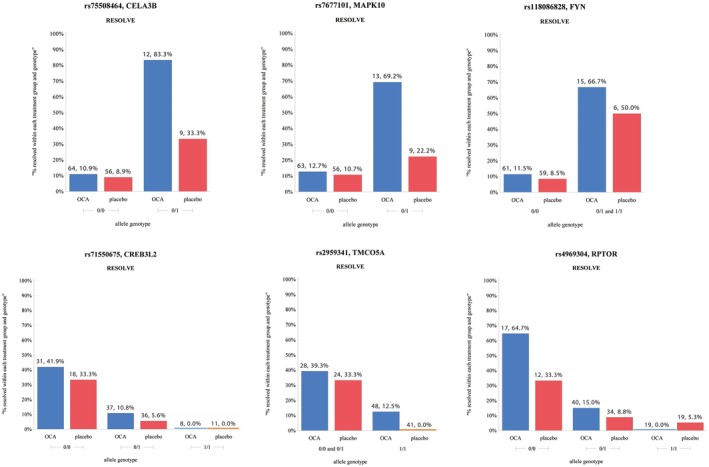
Figure 3.

Genotype bar plot for top SNPs from model 1. (*Excludes missing data; 0/0 = homozygous reference; 0/1 = heterozygous; 1/1 = homozygous alternate; above each bar is the sample size for each group and relative frequency.)

Genotype bar plot for top SNPs from model 1. (*Excludes missing data; 0/0 = homozygous reference; 0/1 = heterozygous; 1/1 = homozygous alternate; above each bar is the sample size for each group and relative frequency.)