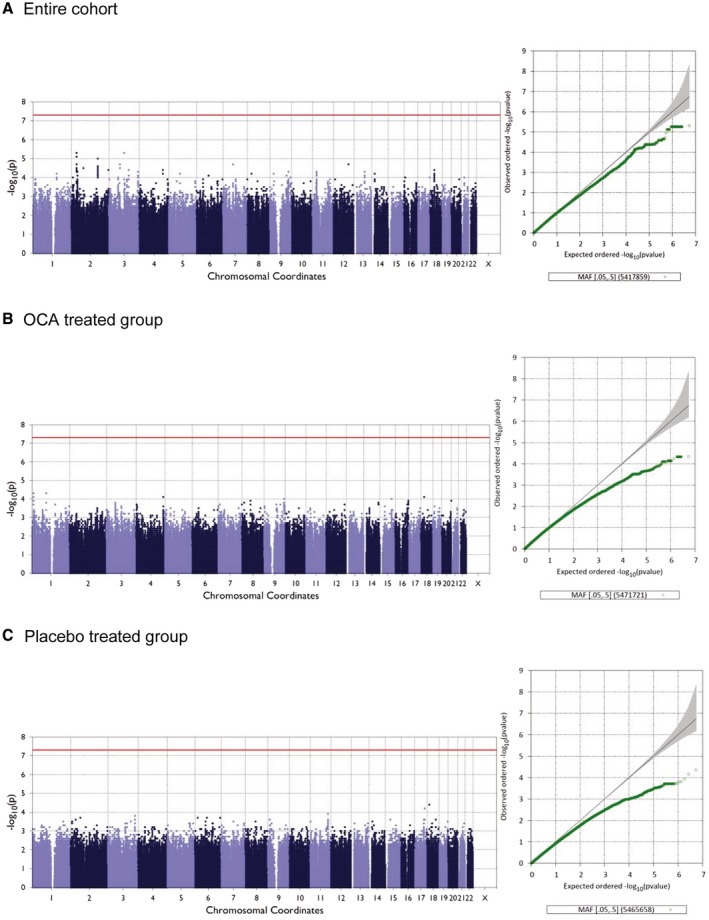
Figure 4.

Manhattan and Q‐Q plots for fibrosis improvement in the entire cohort (A), in the OCA‐treated group (B), and in the placebo‐treated group (C).

Manhattan and Q‐Q plots for fibrosis improvement in the entire cohort (A), in the OCA‐treated group (B), and in the placebo‐treated group (C).