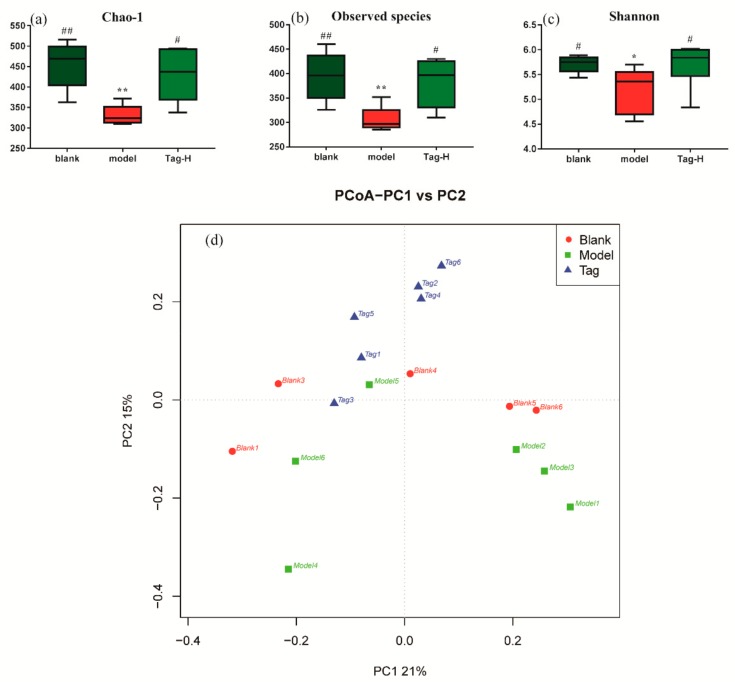
Figure 3.
Alpha diversity indexes and beta diversity indexes in mice. (a) Chao-1 (alpha diversity index), (b) observed species (alpha diversity index), (c) Shannon (alpha diversity index), and (d) PCoA plots based on unweighted uniFrac metrics (beta diversity index). Blank group (days 1–14, distilled water administration period and days 15–28, distilled water administration period); model group (days 1–14, induction of constipation period and days 15–28, distilled water administration period); tagatose group (days 1–14, induction of constipation period and days 15–28, tagatose administration period, Tag-H mice treated with 1.70 g/kg BW tagatose). *, compared with the blank group, p < 0.05; **, compared with the blank group, p < 0.01; #, compared with the model group, p < 0.05; and ##, compared with the model group, p < 0.01.

