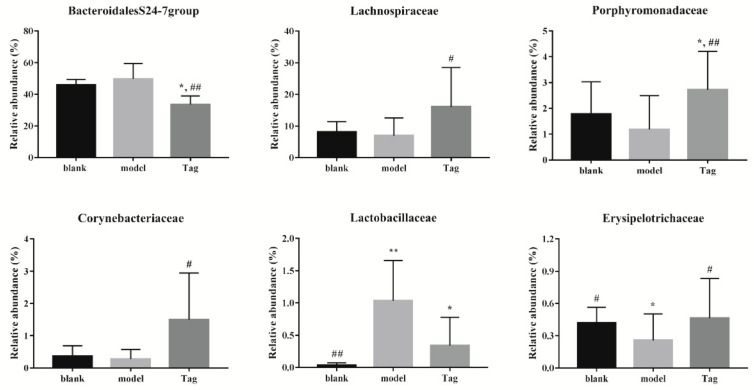
Figure 6.
Changes of the abundance of selected families in different groups (relative abundance more than >0.1%). Blank group (days 1–14, distilled water administration period and days 15–28, distilled water administration period); model group (days 1–14, induction of constipation period and days 15–28, distilled water administration period); and tagatose group (days 1–14, induction of constipation period and days 15–28, tagatose administration period, Tag-H mice treated with 1.70 g/kg BW tagatose). *, compared with the blank group, p < 0.05; **, compared with the blank group, p < 0.01; #, compared with the model group, p < 0.05; and ##, compared with the model group, p < 0.01.

