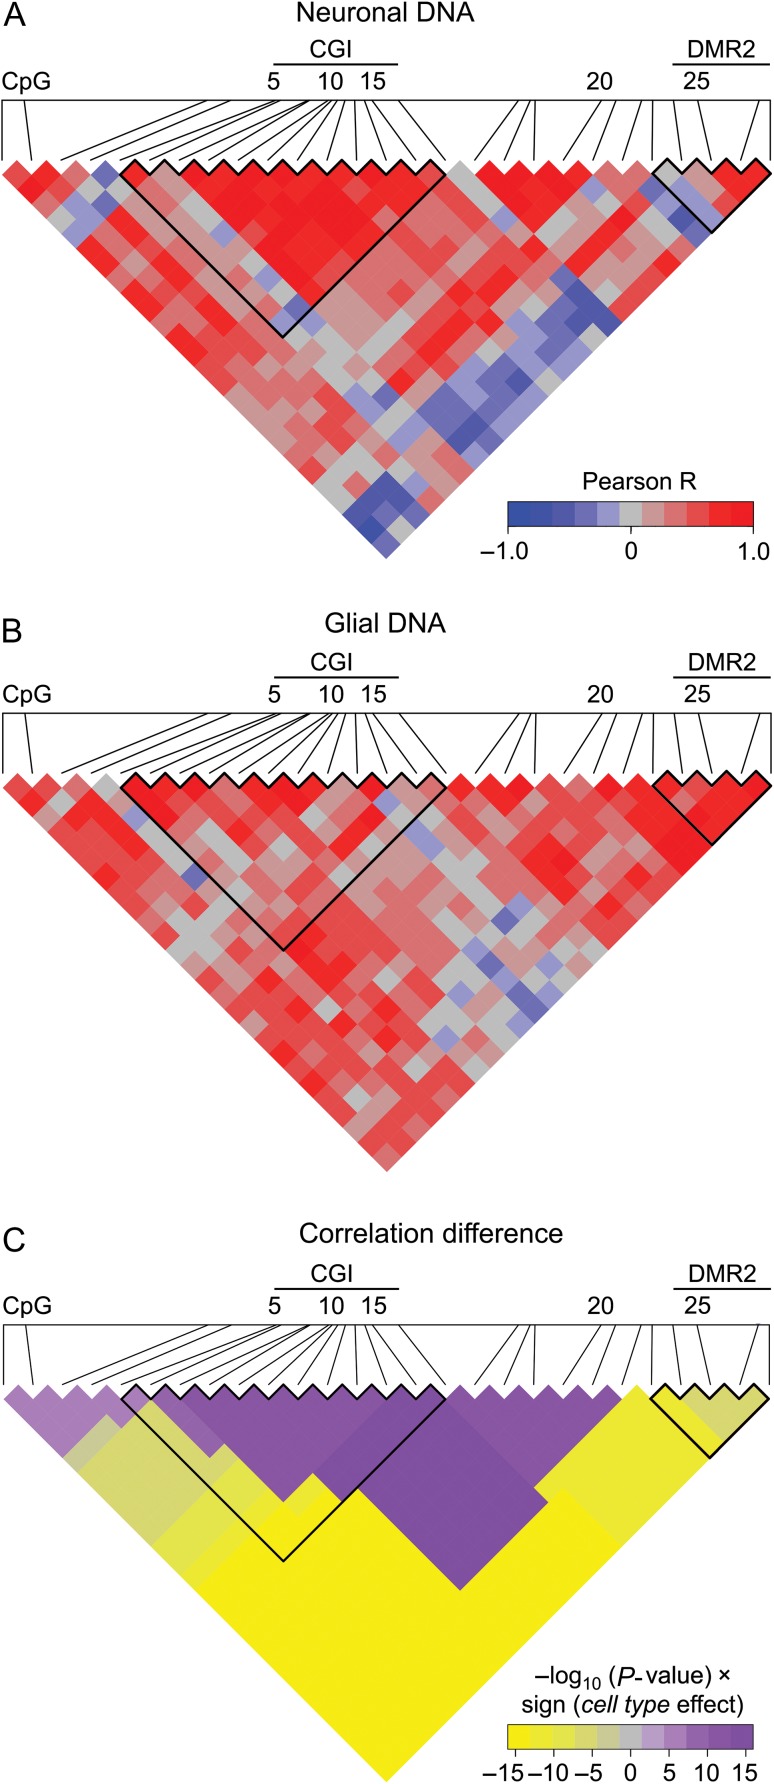
Figure 2.
Central promoter region including the most part of CGI demonstrates high coordination in methylation in neurons, whereas the rest of the promoter in glial cells. (A and B) Heatmap representation of correlations in methylation of 27 CpGs in PDYN promoter in neuronal (A) and glial DNA (B) from dlPFC (n = 12). Scale bar shows the color-coded pairwise Pearson correlation R-values with red and blue indicating high correlations and high anticorrelations, respectively. CGI and DMR2 boundaries are outlined. (C) Heatmap representation of direction and significance of differences between neurons and glia for pairwise Pearson correlations of CpG methylation levels. For each CpG pair in heatmap −log10(P-value) × sign (“cell type” effect) from ANCOVA with the most significant cell type effect (among all regions including this CpG pair, see “Materials and Methods” section) is shown. Purple and yellow colors indicate significantly higher correlations in neurons and glia, respectively. CGI and DMR2 boundaries are outlined.

