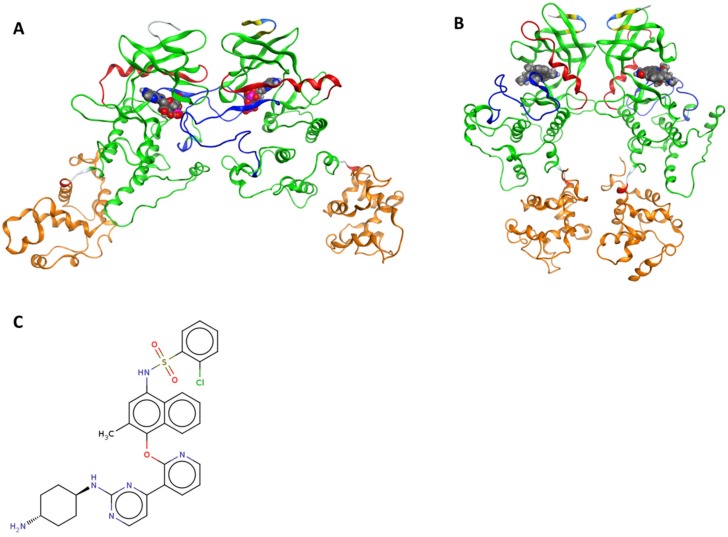
Figure 1.
Ribbon diagram representing the dimeric structures of the inositol-requiring enzyme 1α (IRE1) cytosolic regions. (A) Face-to-face dimer (PDB 3P23). (B) Back-to-back arrangement (PDB 4YZC). The kinase domain is shown in green (residues 571–832), the helix-αC in red (residues 603–623), the activation segment in blue (residues: 711–741), the RNase domain in orange (residues 837–963). The yellow segment represents the β-strand and the cyan the H-bonded turn that are not part of the kinase or RNase domain. ADP and staurosporine are highlighted in spaces filling models in (A) and (B), respectively, to indicate the kinase binding sites. (C) 2D molecular representation of Kinase inhibiting RNase attenuators (KIRA).

