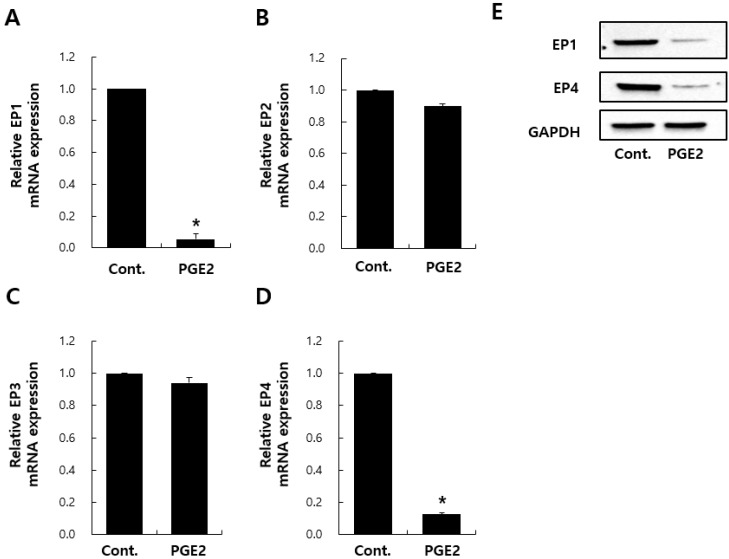
Figure 3.
Analysis of transcript levels of different receptors E-prostanoid 1–4 (EP1–EP4) after PGE2 treatment. Transcriptional expression of PGE2 receptors (EP1–EP4) by NHDFs after 24 h treatment with DMSO or PGE2 (A–D). Immunoblotting analysis for EP1 and EP4 (E). Values represent the mean ± SD of three independent experiments. * p < 0.05 compared to the control.

