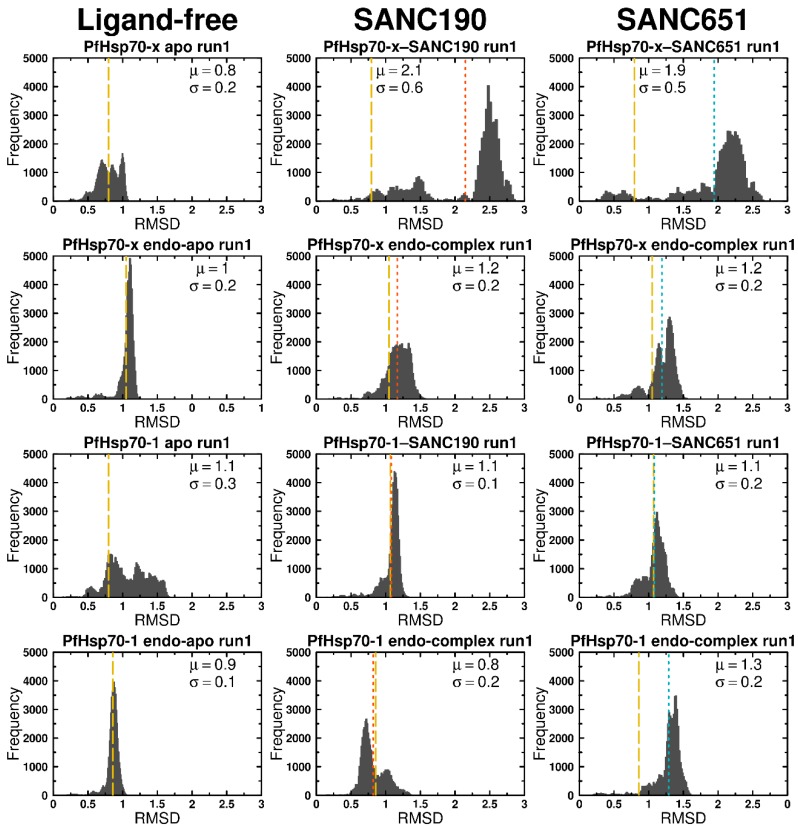
Figure 4.
Histograms of protein backbone RMSDs against the frequency of occurrence. The distribution in conformation populations between ligand-free and ligand-bound trajectories over 100 ns were compared. Dotted lines represent positions of calculated means. Color key: Yellow: ligand-free; red: SANC190-bound; blue: SANC651-bound. Histograms of duplicate trajectories can be found in supplementary data (Figure S4).

