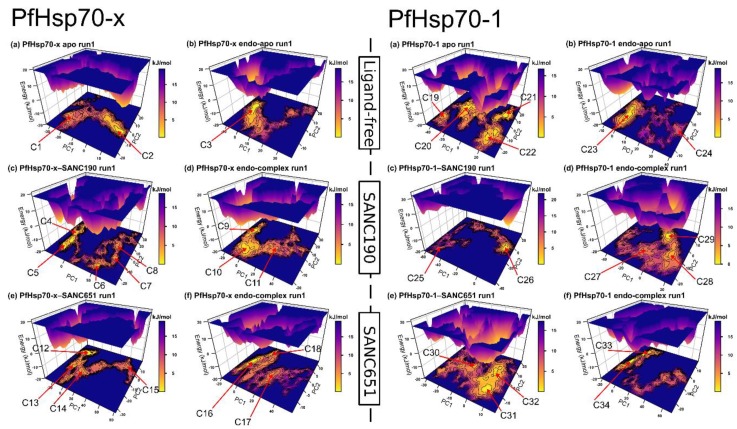
Figure 6.
Gibbs free energy landscapes illustrating conformation equilibrium observables as a function of PC1 and PC2. Colors range from yellow (Gibbs free energy minima) to purple (Gibbs free energy maxima). Each contour ring represents a change in the Gibbs free energy by 1 kJ/mol. Conformations visited (conformers) during simulations were labeled from C1–C30.

