Fig. 4.
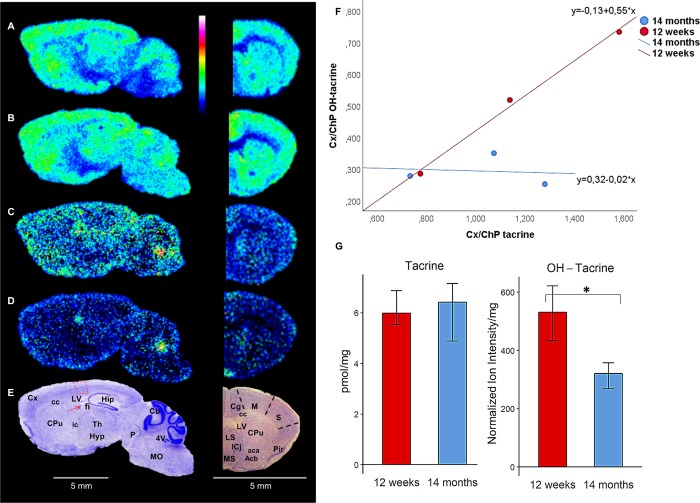
Brain distribution of tacrine and its hydroxylated metabolites after intraperitoneal administration (10 mg/kg). a, b Sagittal and coronal brain tissue sections imaged by MALDI-MS showing tacrine (m/z 199.123) in 12-w and 14-m mice, respectively (35% of max intensity). c, d Sagittal and coronal brain tissue sections imaged by MALDI-MS showing OH-tacrine (m/z 215.118) in 12-w and 14-m mice, respectively (20% of max intensity). Both analytes were imaged by MALDI-MS at a lateral resolution of 80 μm. e The sagittal and coronal brain tissue sections were subsequently washed and subjected to Nissl staining; brain structures of interest are annotated. Areas used for measuring the Cx/ChP ratio (ratio of a compound’s concentration in the somatosensory cortex to its concentration in the choroid plexus) in the sagittal brain tissue sections are highlighted in red. f Scatter plots of Cx/ChP ratios for tacrine (X-axis) and OH-tacrine (Y-axis) (n = 3). g Bar plot of the whole-brain concentration of tacrine (pmol/mg tissue) and normalized ion intensity of OH-tacrine (n = 4). Statistically significant differences (P < 0.05) are indicated with an asterisk (*). Abbreviations: Acb nucleus accumbens, Cb cerebellum, Cg cingulate cortex, ChP choroid plexus, CPu caudate putamen, Cx cortex, Hip hippocampus, Hyp hypothalamus, LS lateral septal nucleus, M motor cortex, MO medulla oblongata, MS medial septal nucleus, P pons, Pir piriform cortex, S somatocensory cortex, Th thalamus, aca anterior commissure anterior part, cc corpus callosum, f fimbria of the hippocampus, ic internal capsule, 4V fourth ventricle, LV lateral ventricle

