
Figure 1.
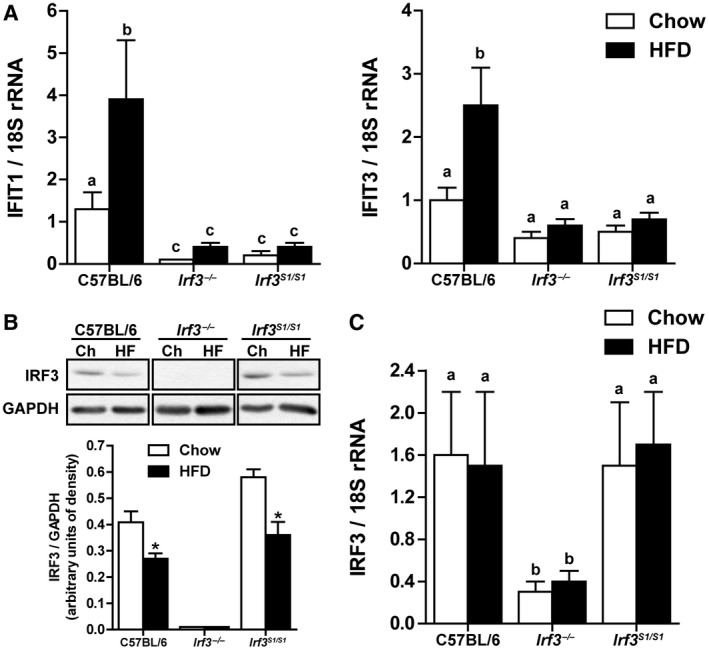
Hepatic IRF3 activation after HFD feeding. Male C57BL/6, Irf3 −/−, and Irf3 S1/S1 mice were fed an HFD or chow for 12 weeks. (A) Expression of IFIT1 and IFIT3 mRNA was analyzed by qRT‐PCR. Values were normalized to 18S and are shown as fold increase over the chow‐fed C57BL/6 control group, n = 12 per genotype. (B) Expression of IRF3 was assessed by western blot and normalized to GAPDH, n = 4 per genotype. (C) Expression of IRF3 mRNA was analyzed by qRT‐PCR. Values were normalized to 18S and are shown as fold increase over the chow‐fed C57BL/6 control group, n = 12 per genotype. Values represent means ± SEM. Values with different alphabetical superscripts are significantly different, P < 0.05. Abbreviations: Ch, chow; HF, high fat.