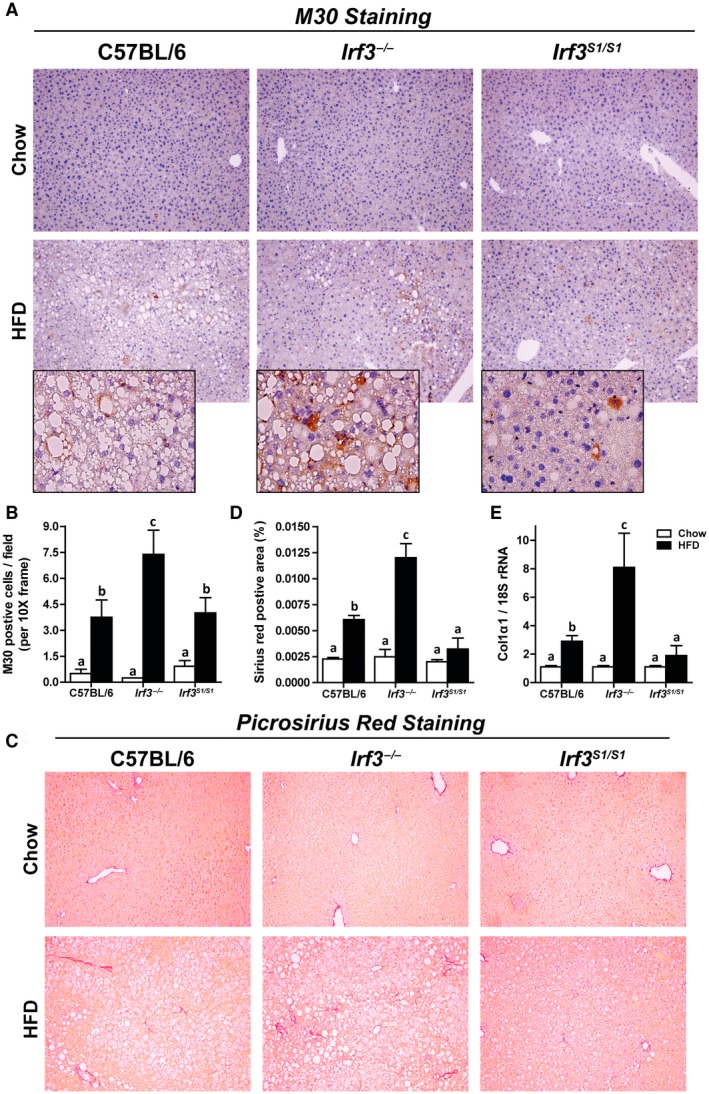
Figure 3.

Enhanced markers of hepatocellular death and fibrosis in Irf3 −/− mice compared with wild‐type and Irf3 S1/S1 mice after HFD feeding. Male C57BL/6, Irf3 −/−, and Irf3 S1/S1 mice were fed an HFD or chow for 12 weeks. (A,B) Paraffin‐embedded liver sections were stained for M30, a caspase‐dependent cleavage product of cytokeratin 18. Images were acquired using 10× and 40× objectives, and the positive area was quantified, n = 4 per genotype. (C,D) Paraffin‐embedded liver sections were stained with sirius red. Images were acquired using a 40× objective, and the positive area was quantified, n = 4 per genotype. (E) Expression of Col1α1 mRNA was analyzed by qRT‐PCR. Values were normalized to 18S and are shown as fold increase over the chow‐fed C57BL/6 control group, n = 8 per genotype. Values represent means ± SEM. Values with different alphabetical superscripts are significantly different, P < 0.05. Abbreviation: Col1α1, collagen 1 α 1.
