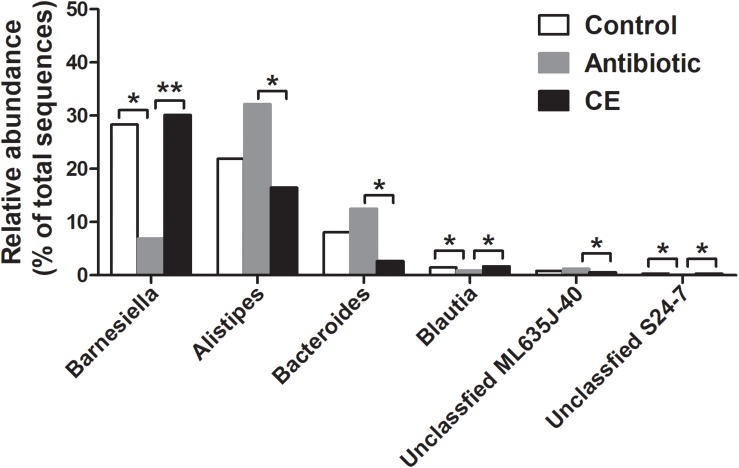
FIGURE 2.
Significantly changed bacteria genera by citrus extract treatment. The values were expressed as the medians (n = 6). Asterisks indicate statistical differences between different groups (Kruskal–Wallis test): ∗FDR-adjusted P value < 0.05; ∗∗FDR-adjusted P value < 0.01. CE, citrus extract; FDR, false discovery rate.

