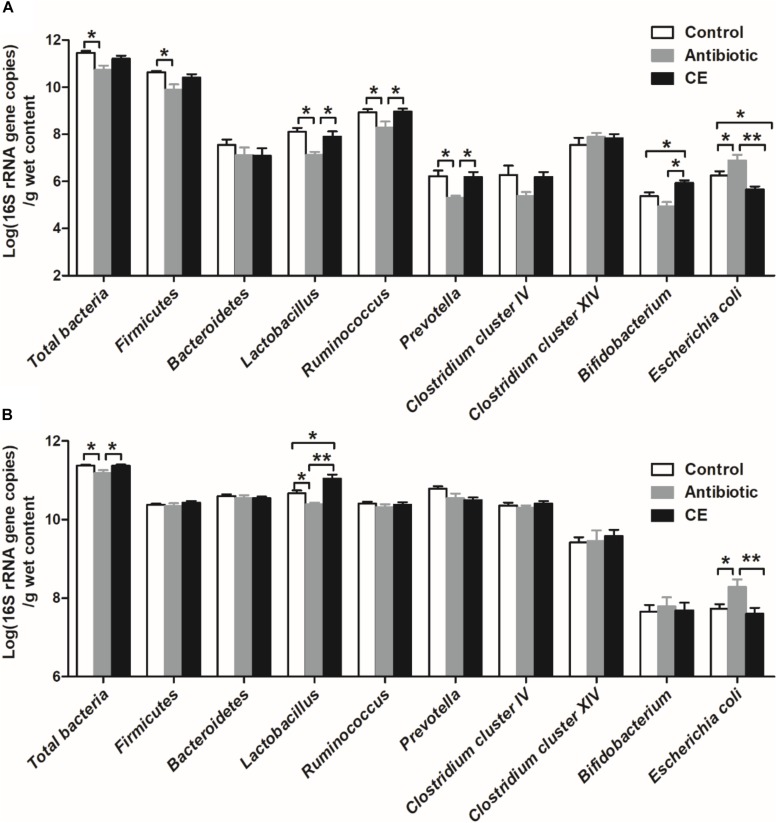
FIGURE 4.
Response of the copy numbers (Log 10 gene copies/g digesta sample) of major bacterial taxonomic groups in the ileal (A) and cecal (B) digesta of Chinese yellow-feathered broilers toward citrus extract treatment. The values are means ± SEM (n = 6). Asterisks indicate statistical differences between different groups (one-way ANOVA with a Tukey post hoc test): ∗P < 0.05. CE, citrus extract.

