
Figure 4.
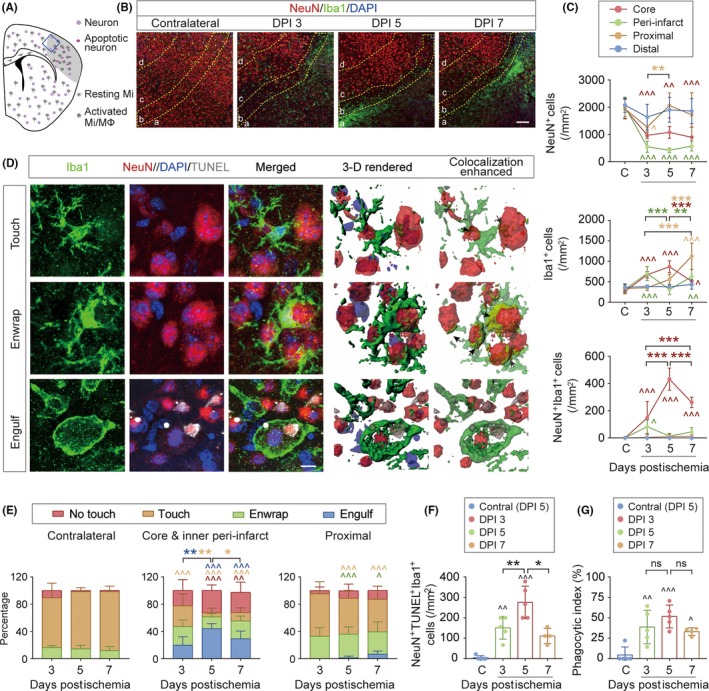
Activated microglia and macrophages phagocytose dead/dying neurons at the subacute stage after cerebral ischemia. Mice were subjected to permanent focal cerebral ischemia induced by dMCAO. A, A schematic cartoon illustrating the distribution of morphologically viable neurons, dead/dying neurons, resting microglia (Mi), and activated microglia/macrophages (Mi/MΦ) in the ipsilesional hemisphere during the subacute stage (3‐7 days) after dMCAO. Gray area: infarct. Blue square: the area surrounding the infarct where images in B were taken. B, Representative images of NeuN, Iba1, and DAPI triple‐label fluorescence in the ipsilesional hemisphere 3, 5, and 7 days postischemia (DPI) and in the noninjured contralateral hemisphere 5 DPI. The image field was divided into four areas as described in Section 2: (a) infarct core; (b) inner peri‐infarct area; (c) proximal area; and (d) distal area. Scale bar: 100 μm. C, Quantification of NeuN‐positive cells (top), Iba1‐positive cells (middle), and NeuN/Iba1 double‐positive cells (bottom) in the infarct core, inner peri‐infarct area, proximal area, and distal area at indicated time points after dMCAO, and in the noninjured contralateral hemisphere (“C”) 5 days after dMCAO. D, Representative images of brain sections stained with NeuN, Iba1, DAPI, and TUNEL demonstrating the interactions between neurons and microglia/macrophages 5 days after dMCAO. Color‐merged images were 3D‐rendered by Imaris software (4th column), with NeuN/Iba1 contact surface enhanced (5th column). Arrow: NeuN and Iba1 contact surface (yellow). Iba1+ cells were classified into four types according to their contact area with NeuN immunosignal as described in Section 2: no touch, touch, enwrap, and engulf (also see Figure S1 and Videos [Link], [Link], [Link], [Link]). NeuN+TUNEL+ cells were frequently observed to be engulfed in Iba1+ cells, indicating phagocytosis of apoptotic neurons by microglia/macrophages. Scale bar: 7 μm. E, Percentage of microglia/macrophages showing no touch, touch, enwrap, or engulf relations with neurons in the noninjured contralesional hemisphere (left panel), ipsilesional infarct core and inner peri‐infarct areas (middle panel), and proximal area (right panel) 3‐7 days after dMCAO. F, Quantification of NeuN/TUNEL/Iba1 triple‐positive cells (microglia and macrophages engulfing dead/dying neurons) in the infarct core (area a in B) 3‐7 days after dMCAO. G, Phagocytic index was calculated as the percentage of dead/dying neurons engulfed by microglia/macrophages in the infarct core (area a in B) 3‐7 days after dMCAO. n = 4‐5 mice per group. *P < .05, **P < .01, ***P < .001 between different time points after ischemia, as indicated. ^P < .05, ^^P < .01, ^^^P < .001 vs. noninjured contralateral hemisphere. ns, no significant difference