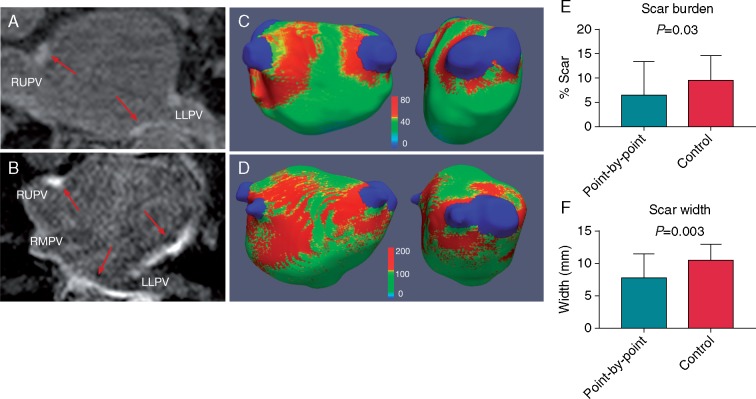
Figure 3.
LGE-CMR images and scar maps. Left panel: LGE-CMR imaging. Red arrows indicate sites of high signal intensity surrounding the pulmonary veins and in the left atrial body in a point-by-point (A) and control patient (B). Middle panel: corresponding three-dimensional left atrial scar maps, thresholded at 3.3 SD above the mean blood pool SI demonstrate a lesser degree of scar (red areas), with a narrower encirclement width in point-by-point (C) vs. control patients (D). Colour scale represents raw signal intensity. Total scar burden (E) and scar width (F) were significantly lower in point-by-point vs. control groups CMR, cardiovascular magnetic resonance; LGE, late gadolinium enhancement; LLPV, left lower pulmonary vein; RMPV, right middle pulmonary vein; RUPV, right upper pulmonary vein; SI, signal intensity.

